Ignition Layer
Where fires start: human-context ignition susceptibility (captures the wildland-urban-interface hump — peaks rural/exurban, falls in fuel-less urban cores) plus a lightning ignition index, combined into a relative total propensity. Feeds the Petrel Wildfire pipeline. v0.3 corrects the lightning band: through v0.2 it was labelled events/km²/yr and documented as a physical rate, but its absolute level was set by a clip in the conversion step — integrated over land it implied roughly 2,300× the real-world number of lightning ignitions per year. It now ships as an explicit 0–1 relative index. The spatial pattern is unchanged, and the total band is unchanged to within rounding; an absolute rate calibration is a v1.0 item. v0.2 had replaced the v0.1 combine step: lightning is converted to a probability (1 − e^(−l/l₀)) rather than normalised and clipped, which had pinned 2.26% of land at a single indistinguishable value. The l₀ scale is provisional — the independent check reported at that release was withdrawn after a defect was found in the simulations behind it.
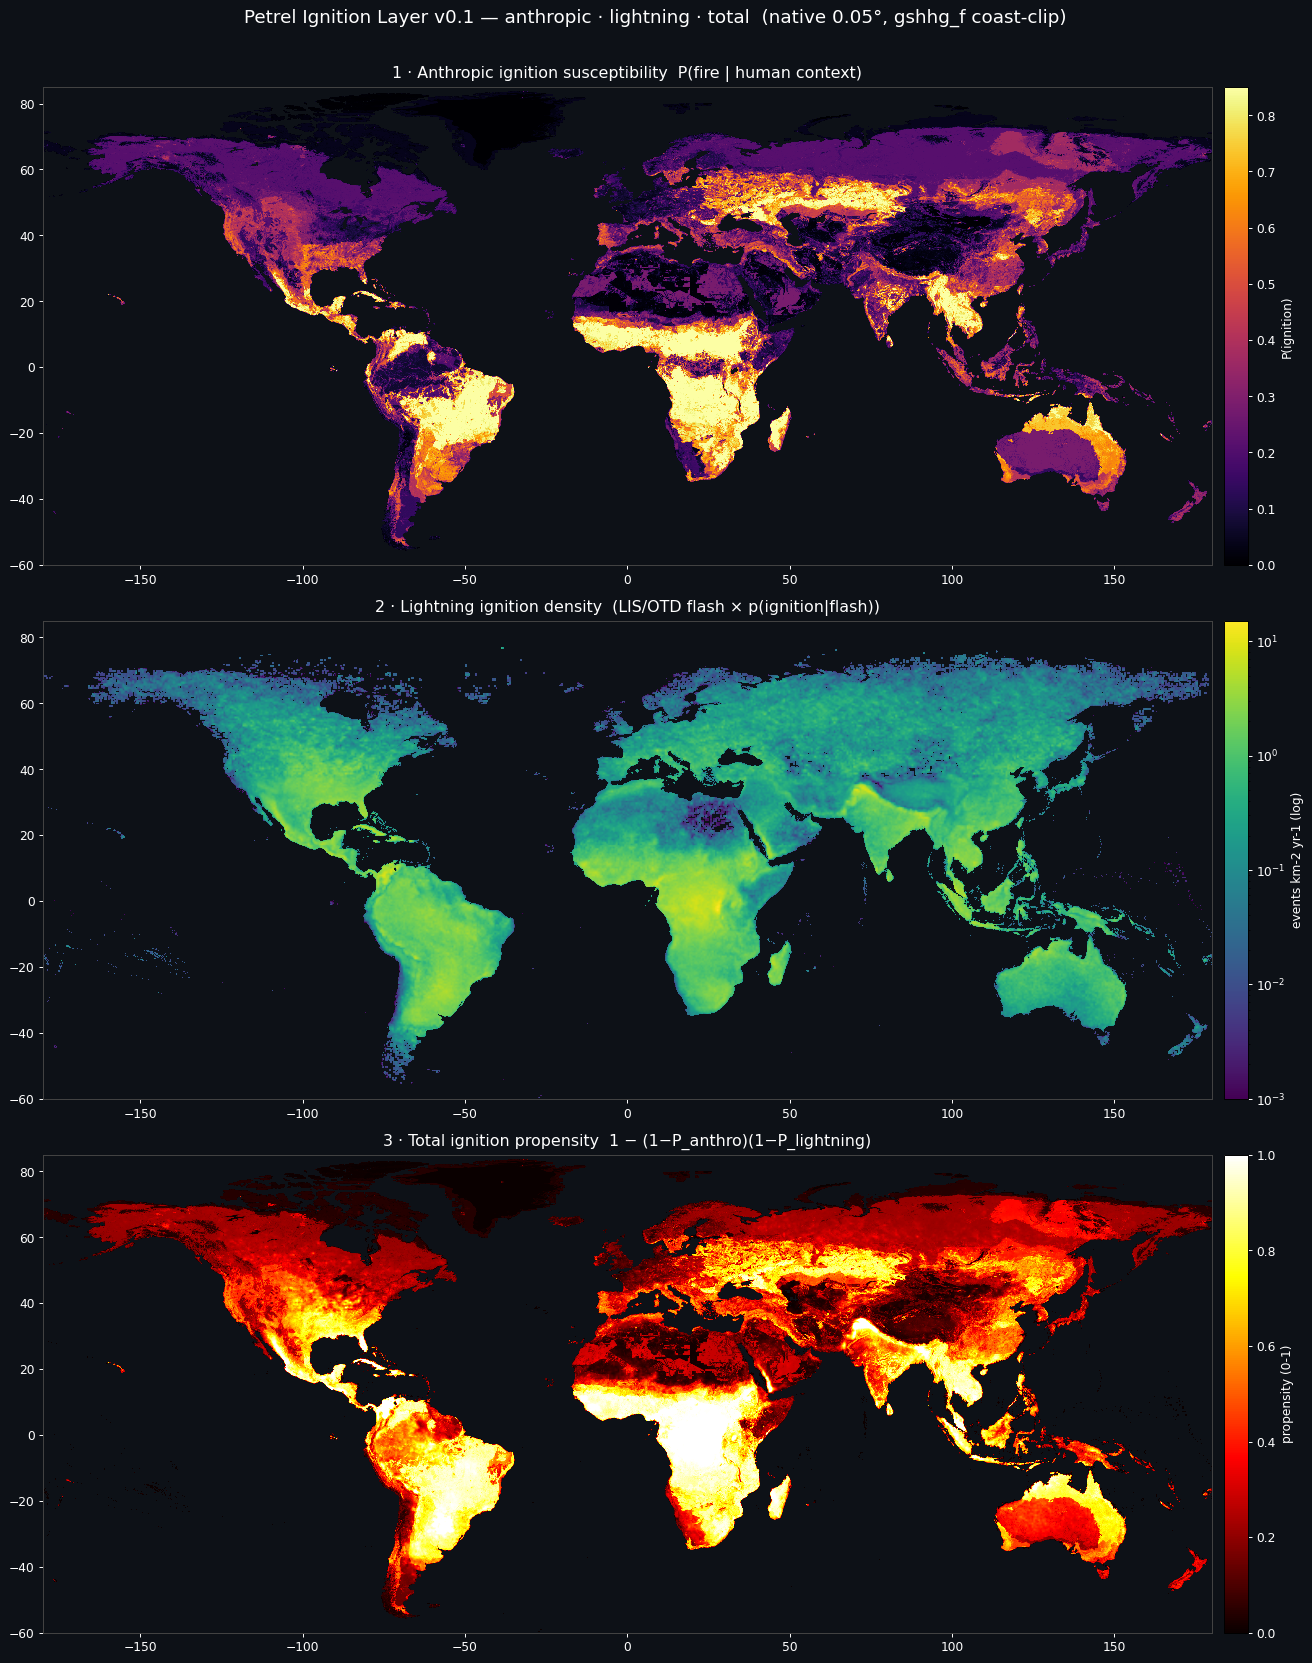
What ships in the bundle
3 global ~5 km (0.05°) GeoTIFFs (~33 MB total) plus the full documentation set. All files are Cloud-Optimized GeoTIFFs with internal tiling and overviews — fast for both bulk download and windowed reads.
Method
Inputs · GHSL R2023A (population, built-up, settlement), HYDE 3.3 cropland/grazing, NASA LIS/OTD flash climatology, Beck 2018 Köppen-Geiger
Training labels · NASA FIRMS MODIS/VIIRS fire detections (fire presence, 2015-2023)
Method · Gradient-boosted anthropic ignition model + LIS/OTD lightning climatology
Documentation
Open — no account needed. The data below requires a free API key.
- README — entry point + quick start
- Methodology — how the model was built
- Model card — intended use, biases, limitations
- Data sources — input data citations
- Validation report — accuracy + known limitations
- Changelog — vintage evolution
- Licence — terms of use for this layer
- Citation — how to cite this dataset
- API usage — code snippets
- Bulk download — fetching the whole bundle
Download
Free for academic, research, and other non-commercial use. Account required.
# $PETREL_API_KEY = your API key (tlk.…) from the dashboard — free tier works.

# 1. Fetch 1-hour signed URLs for every file in the bundle:
curl -s -H "X-API-Key: $PETREL_API_KEY" \
  https://api.petreldata.io/v1/layer/ignition/v0.3/bundle > bundle.json

# 2. Download the full layer (~33 MB):
mkdir -p ignition_v0.3
jq -r '.files[] | [.url, .name] | @tsv' bundle.json | \
  while IFS=$'\t' read -r url name; do
    curl -s "$url" -o "ignition_v0.3/$name"
doneLicense & citation
License: CC-BY-NC-4.0. Free for academic, research, and other non-commercial use. For commercial licensing, contact petreldata.io@gmail.com.
Citation:
Petrel (2026). Petrel Ignition Layer v0.3.
https://petreldata.io/layers/ignition
CC-BY-NC-4.0
Version history
- The lightning band is a relative index, not a rate — label corrected. Through v0.2 ignition_density_lightning_0p05deg.tif shipped tagged events km⁻² yr⁻¹, and README/methodology called it "a physical rate". It is not one, by roughly three orders of magnitude: integrated over the 129.3 M km² land footprint the v0.2 band implies 115,532,486 lightning ignitions per year globally, against a real-world figure of order 50,000 — a factor of ~2,300.
- Cause. train_lightning_conversion forms p(ignition|flash) by dividing a record-total burned count by an annual flash rate — two different time bases — and then clips the ratio at 0.1. For many regions the absolute level was therefore set by the clip ceiling, not by data. The function's own docstring states the same-units assumption that the call site violates.
- Fix. The band is now normalised by its global maximum and ships as relative index 0-1 (lightning_relative_index), with the divisor recorded in the band attributes so the raw field is recoverable. Division by a constant is strictly monotonic, so the ordering is untouched — verified on 200,000 sampled cells — and no information is lost under uint16.
- The total band is unchanged to within quantisation. combine_ignition normalises lightning by its own p99, so a constant rescale cancels exactly: the float field matches v0.2 to 1.8e-07. After uint16 encoding, 604 of 6,260,560 valid cells (0.0096%) differ by exactly 1 LSB — 1.5e-05 in propensity — where a float value sat on a rounding boundary. No cell differs by more than 1 LSB and the nodata masks are identical. Nothing downstream moves: the wildfire seed map, and the in-flight v6 campaign, are unaffected. This is what made the correction safe to ship immediately rather than deferring it to a quiet moment.
- What this does NOT fix. v0.3 stops us *claiming* a rate; it does not produce one. A true events km⁻² yr⁻¹ calibration needs the time-base fix and removal of the clip, and is a v1.0 item.
- total was not reproducible from the shipped bands — methodology.md still described the v0.1 CLIPPED construction. The bundle carried a v0.1 method description, a v0.2 artifact and a v0.3 release note announcing the fix, all at once. A user following the documented formula (clip(l/p99, 0, 1) then the OR) matched the shipped raster on only 55.6% of cells within 1e-2, with a maximum error of 0.24 in propensity. The method section now documents the actual transform, total = 1 − (1 − P_anthro)·exp(−l/l₀), which reproduces the raster to a median residual of ~2e−05.
- l₀ is now published, because it is not recoverable from the product. The effective divisor is 0.220418, a build-time percentile over a different pixel population than the coast-clipped raster you receive — recomputing p99 from the shipped lightning band gives ~0.299 and will not reproduce total. It is also the scale under review, so it is documented as provisional and vintage-specific. (Carrying it into the total band's own attributes needs a re-encode and is a v1.0 item.)
- Two further stale lines in methodology.md: it called lightning "a rate" — contradicting this vintage's own README — and listed a 16.0 cap for a band that now ships capped at 1.0.
- Correcting v0.2's docs without rewriting them. The v0.2 bundle shipped with self-referential promises — its validation report read *"v0.2 has not been formally validated … wait for v0.2"* — because the doc templates hardcode the version and the bulk bump to v0.2 turned every v0.1 promise into a promise about itself. v0.2 is left exactly as published: a vintaged bundle should say what it said, and editing it would make the record of what we shipped less true, not more. The correction lives here instead. The promote audit now fails any bundle whose docs promise their own vintage, so a re-promote of v0.2 would be stopped — which is correct, because a re-promote is a republication.
- Docs corrected beyond the units. The v0.2 templates had been bulk-bumped from v0.1, which turned forward-looking promises into self-reference — the validation report read "v0.2 has not been formally validated … wait for v0.2". Promises now point at v1.0 and identity strings at v0.3. The total band's own note attribute also promised an absolute calibration "in v0.2"; it now names v1.0 and records that the v0.2 promise did not land.
- Fixes a clipped total band in v0.1. The combine step normalised the lightning rate by its 99th percentile and hard-clipped it to 1.0 (clip(l / p99, 0, 1)); the probabilistic OR then propagated that to total == 1.0 regardless of the anthropic component. Measured on the shipped v0.1: 141,430 pixels — 2.26% of land — pinned at exactly the encoding ceiling, versus ~90 pixels per code immediately below it (a 1,473x spike, which is what distinguishes a hard clip from smooth saturation). The two source bands were unaffected (0 clipped).
- Why it mattered more than the count suggests. Among clipped pixels the anthropic value ranged 0.0078–0.9947, so a remote lightning-driven cell was indistinguishable from a dense wildland-urban-interface cell — precisely where the distinction carries the most information.
- The fix is a correction, not a patch. Lightning is now converted to a probability via 1 - exp(-l/p99). The probabilistic OR is only *defined* on probabilities; combining a 0–1 probability with a normalised events/km²/yr rate was an invalid operation that produced plausible-looking numbers. The new transform is strictly monotonic and never saturates.
- Effect on values. All total values change, not only the clipped ones — a cell at the p99 lightning rate now reads ~0.632 rather than 1.0. The distribution shape is preserved (p99/p50 3.4, was 3.5) while the top percentile regains roughly 6x its encoded resolution (1087 quanta of spread, was 177) and nothing clips.
- Downstream note. The v4 wildfire seed map was sampled from the clipped total, so the top 2.26% of ignition density was flattened at sampling time; a re-seed is the clean answer and is tracked as a v6 re-simulation item.
- Re-encoding the band could never have fixed this: the float32 values were genuinely 1.0 *before* quantisation.
- ⚠ l0 is PROVISIONAL — the independent check was WITHDRAWN 2026-09-03. It was reported here at release as validated: the wildfire session scored six candidates against 20-year GFED using only the footprint emulator's expected-area term (fuel/terrain/weather), so no candidate graded its own ignition field; every de-clipped candidate beat the shipped clip on the affected pixels (Poisson deviance 26.49–27.24 vs 27.48) and on ordering within them (Spearman rho 0.711–0.721 vs 0.710), with a neutral global change (28.007 vs 28.022). That instrument is now known to be contaminated. On 2026-09-03 the wildfire session found that Cell2Fire ignores Ignitions.csv unless --ignitions is passed and the runner never passed it (dropped in a June wiring commit): every v3–v6 simulation ignited at a uniformly random burnable cell of its window, so every per-fire training row paired a footprint with the wrong cell's fuel/slope/elevation/ cropland/canopy. The emulator's local-covariate response — precisely the fine-grained term the affected-subset comparison rests on — is therefore noise. Regional and weather effects survive (the random cell is still inside the same ~50 km window), so the direction of the result may well hold, but it is not evidence today. Re-run after the v6 re-simulation, not before.
- What that does NOT touch: v0.2 itself. The clip was measured directly on the shipped raster — the histogram at the encoding ceiling — with no simulation involved, and the case for 1 - exp(-l/p99) is analytic: the probabilistic OR is only defined on probabilities, so the v0.1 combine was invalid on its own terms. The v0.2 correction stands independently of the emulator. What is unsettled is only the *choice of l0* among de-clipped candidates — a scale, not the shape or the fix.
- The optimum is broad: l0 = max/2 (7.84) edged out p99 on the affected subset by ~0.5% relative deviance and 0.0026 rho. That margin sat inside the instrument's own uncertainty even as first reported (the emulator was trained on v4 simulations whose seeds were drawn from the *clipped* field), and the 2026-09-03 ignition-registration defect above compounds it — so p99 was kept: it is zero-clipping, shape-preserving, and reuses a constant the code already computes. Worth revisiting only with a cleaner instrument after the v6 re-seed, not before.
- Note for anyone re-running that comparison: the *global* deviance metric prefers smaller l0, the opposite direction. It is dominated by the ~98% of cells where lightning is low and the anthropic term carries the signal, so it barely exercises the transform; the affected-subset column is the one that answers the question.
- Initial release. Three global layers at native ~5 km (0.05°): an anthropic ignition susceptibility — P(fire | human context), 0–1 — from a gradient-boosted classifier on GHSL settlement/built-up/population, HYDE cropland and grazing, and Köppen climate, trained on NASA FIRMS fire detections (it recovers the wildland-urban-interface hump: peak ignition at rural/exurban densities, falling in fuel-less dense-urban cores); a lightning ignition density — events/km²/yr — from the NASA LIS/OTD flash climatology times a per-Köppen probability that a flash starts a fire; and a total ignition propensity — a relative 0–1 field combining both sources, built as the ignition-sampler input for the Petrel Wildfire Hazard. The total is a spatial ranking, not an absolute rate; rate calibration and quantitative validation are the headline v0.2 items.
- Native resolution, honestly. The drivers (LIS/OTD 0.5°, GHSL 1 km, HYDE 5′) don't support 90 m, so the layer ships at its true ~5 km resolution — the whole bundle is ~35 MB. Consumers that need finer grids resample on read.
- Free, non-commercial Layer. Distributed under CC-BY-NC-4.0 via the Petrel API; all inputs are commercial-clean (no share-alike sources). Commercial use is licensed separately.