The data that feeds the
hazards.
Layers are global derived data products that Petrel builds to power our hazard models. We open them up for the broader community — fire scientists, climate researchers, geospatial engineers — under CC-BY-NC-4.0 with free account signup. Commercial use is available on request.
Every Layer ships with a model card, methodology document, source provenance, validation report, and citation. Distribution is via the Petrel API — global 90 m GeoTIFFs, signed S3 URLs, rate-limited per account tier.
Live
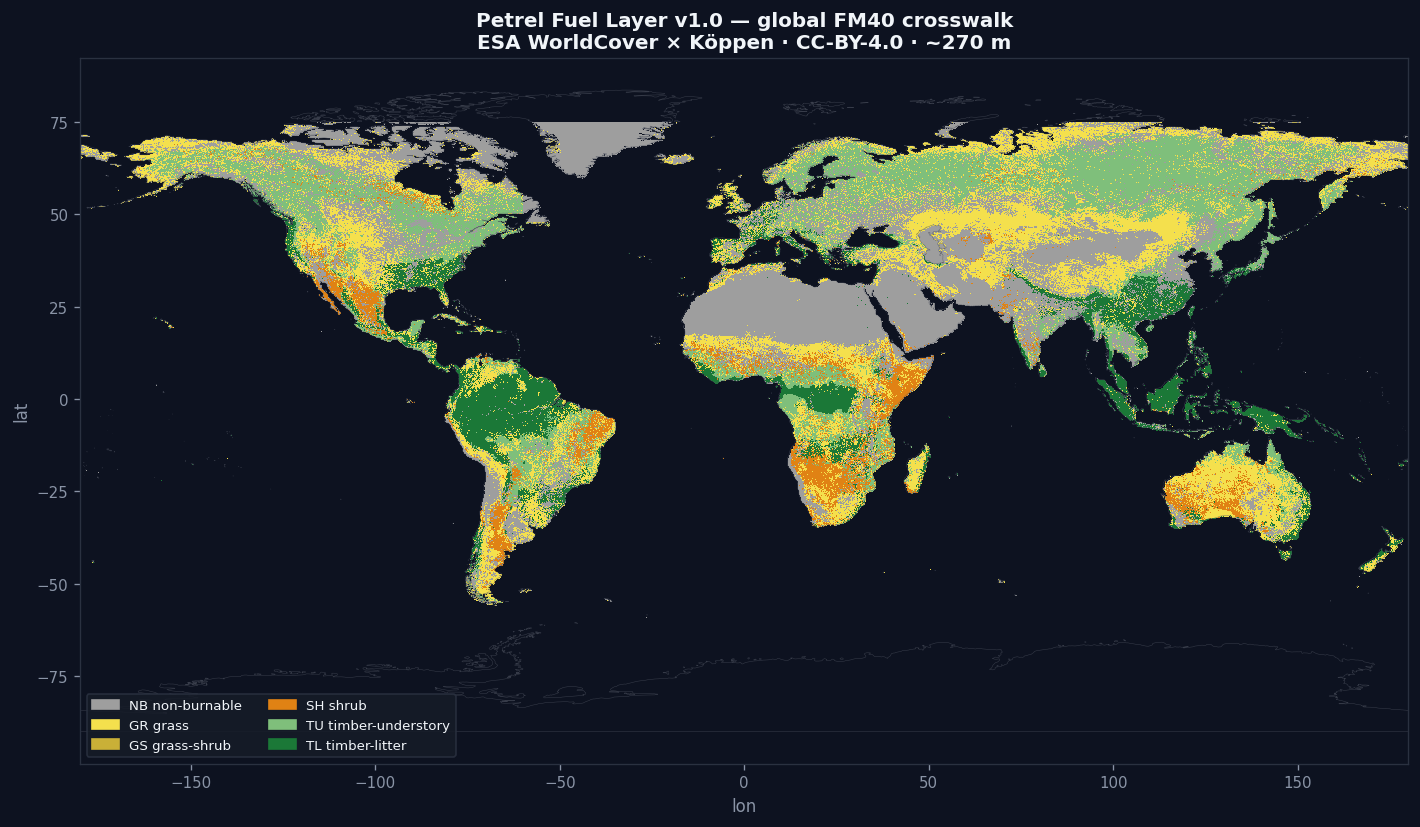
Fuel Layer
What fuels a surface fire — the Scott & Burgan FM40 fuel-model class, assigned deterministically from land cover × climate (grass, shrub, timber-litter, timber-understory, non-burnable). Feeds the Petrel Wildfire Hazard (Cell2Fire) and works standalone for fuels mapping. v1.0 replaces the earlier CC-BY-NC ML fuel line — a single-class, commercial-clean crosswalk under CC-BY-4.0.
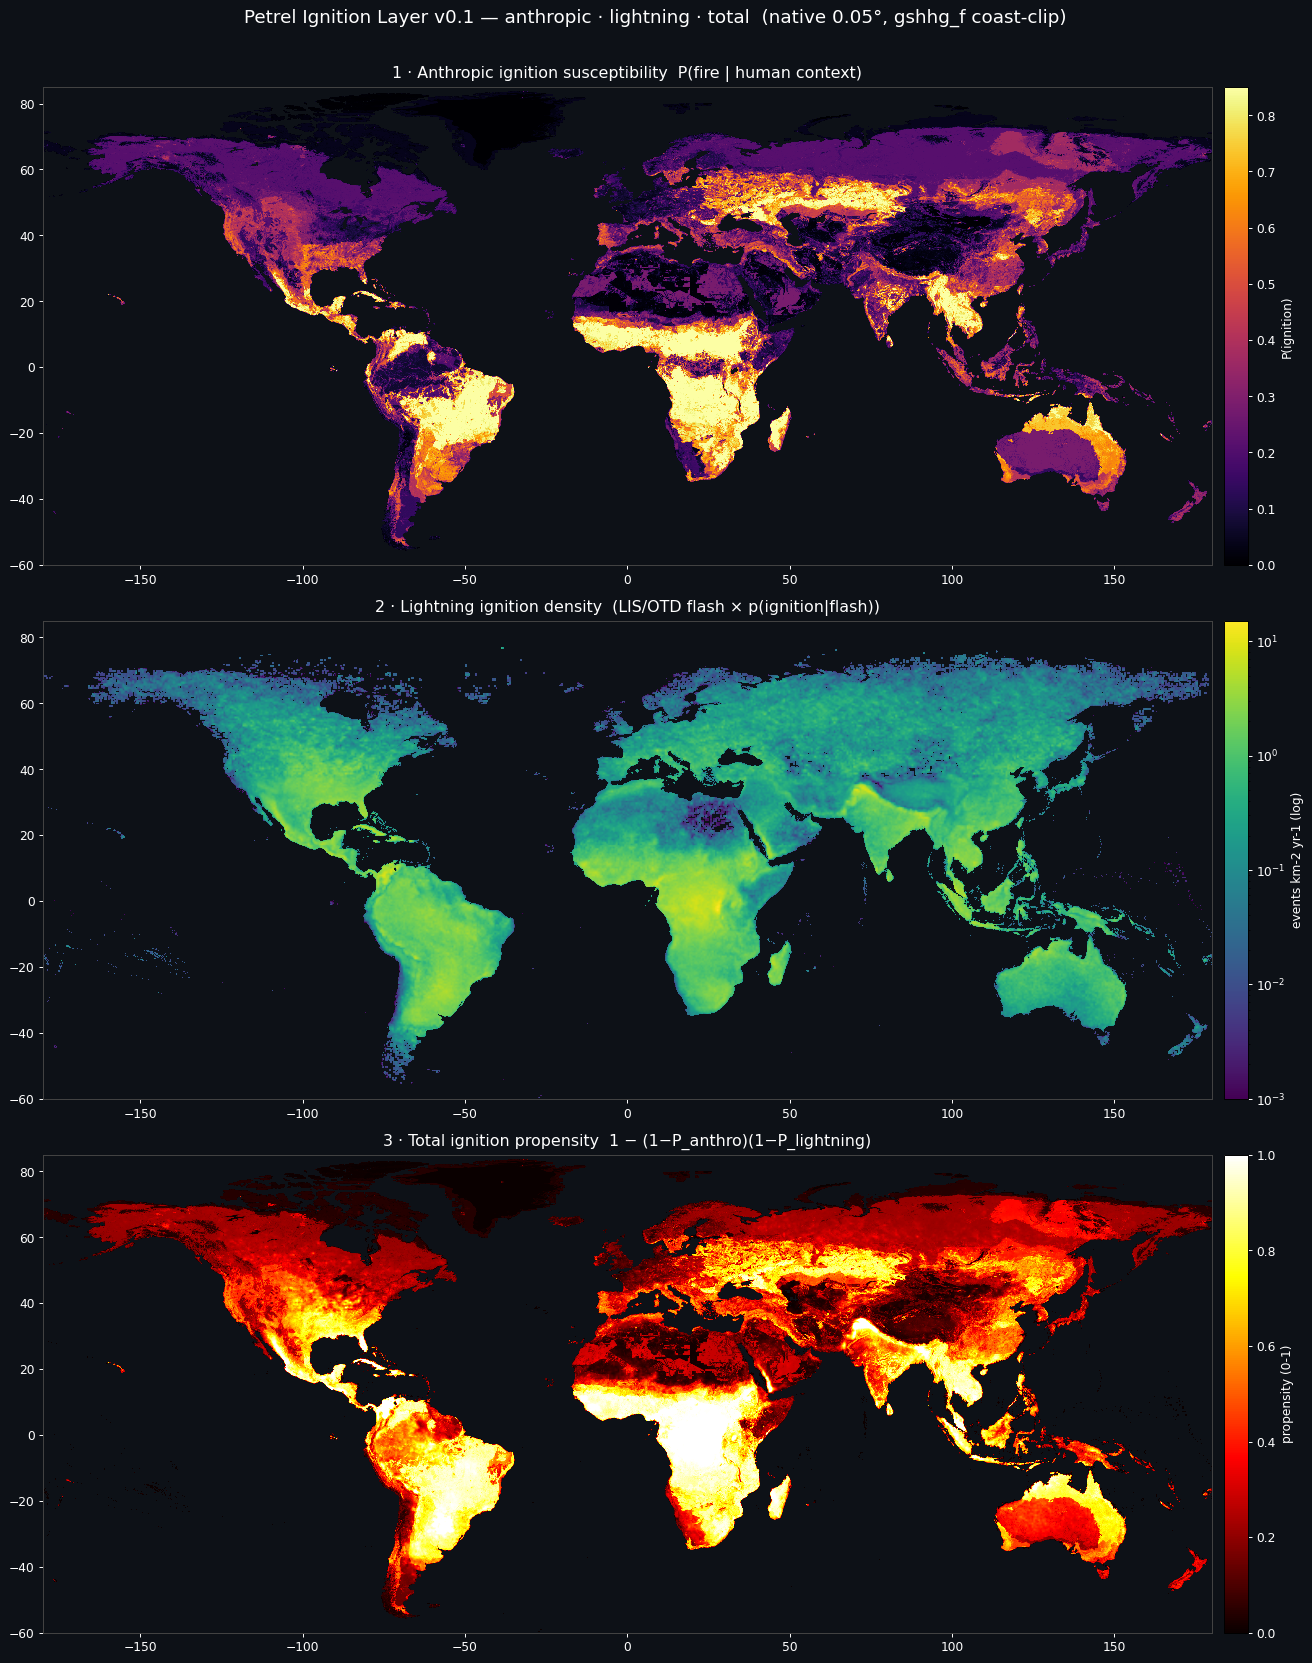
Ignition Layer
Where fires start: human-context ignition susceptibility (captures the wildland-urban-interface hump — peaks rural/exurban, falls in fuel-less urban cores) plus a lightning ignition index, combined into a relative total propensity. Feeds the Petrel Wildfire pipeline. v0.3 corrects the lightning band: through v0.2 it was labelled events/km²/yr and documented as a physical rate, but its absolute level was set by a clip in the conversion step — integrated over land it implied roughly 2,300× the real-world number of lightning ignitions per year. It now ships as an explicit 0–1 relative index. The spatial pattern is unchanged, and the total band is unchanged to within rounding; an absolute rate calibration is a v1.0 item. v0.2 had replaced the v0.1 combine step: lightning is converted to a probability (1 − e^(−l/l₀)) rather than normalised and clipped, which had pinned 2.26% of land at a single indistinguishable value. The l₀ scale is provisional — the independent check reported at that release was withdrawn after a defect was found in the simulations behind it.
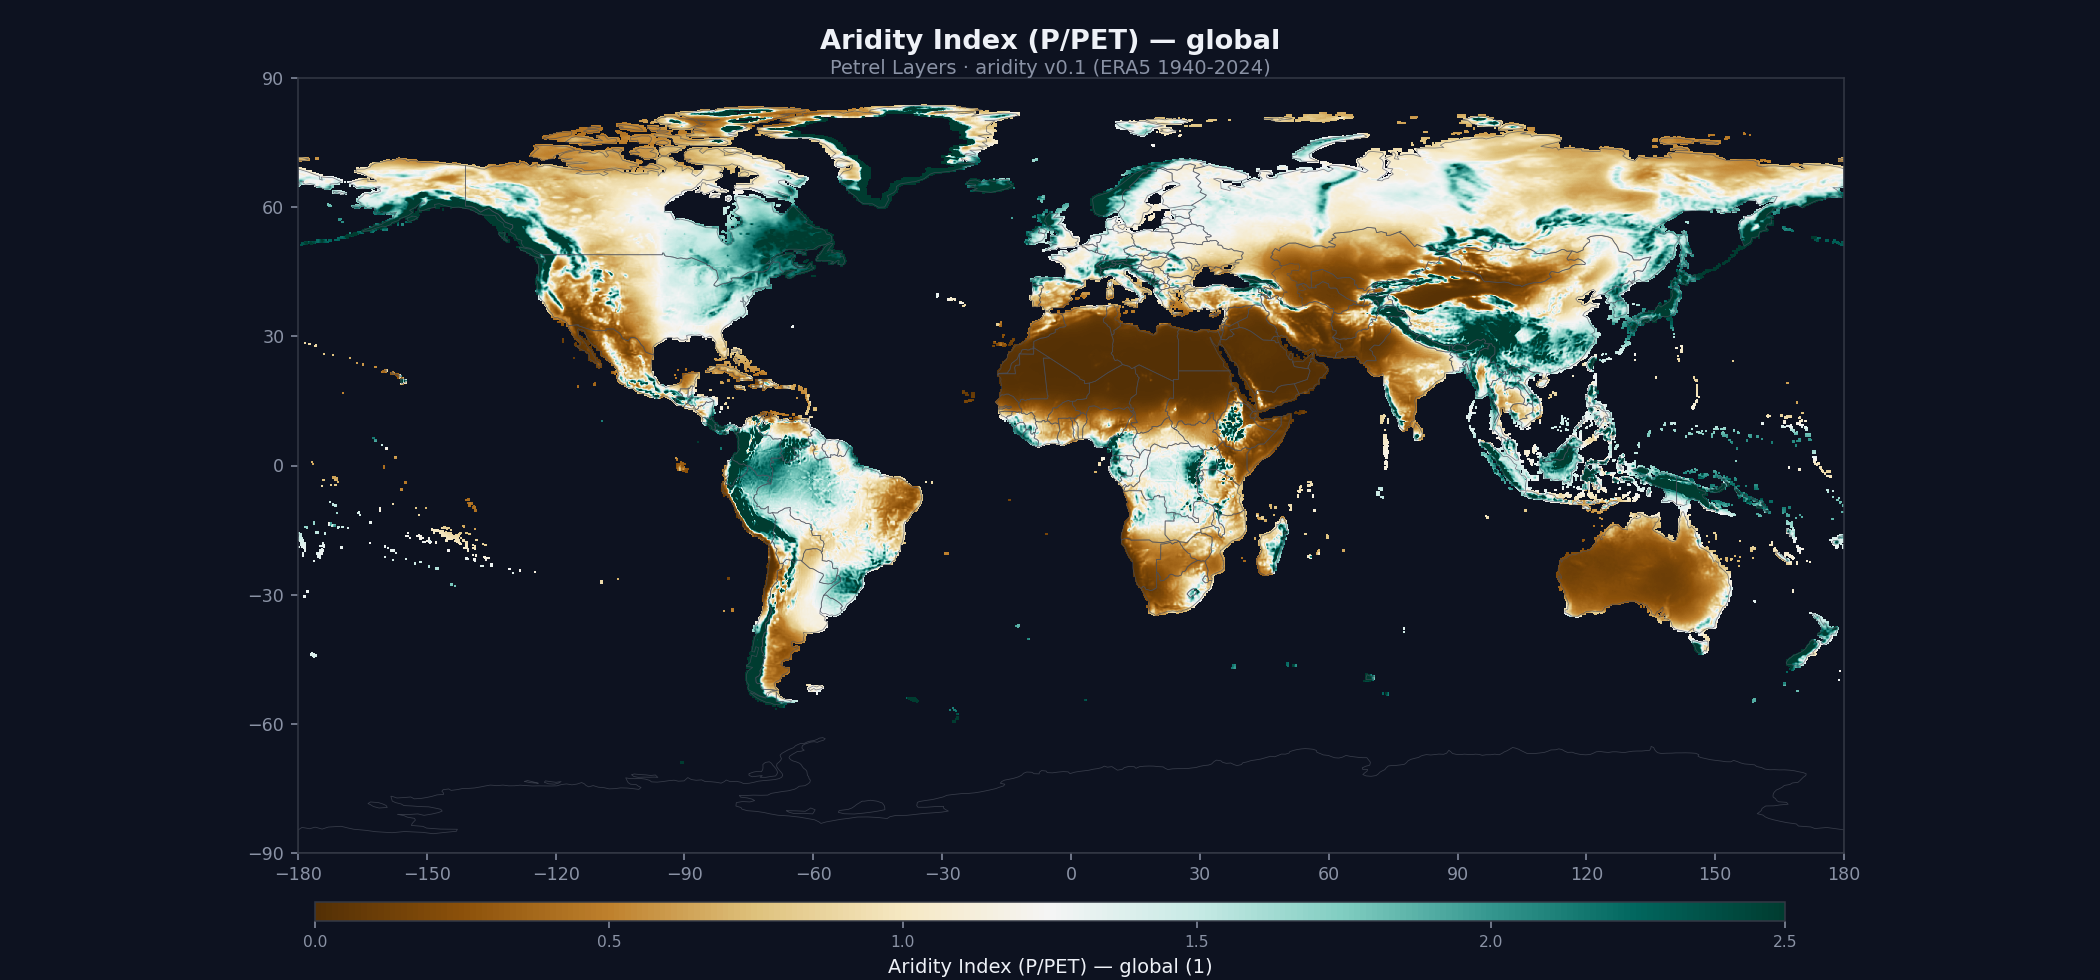
Aridity Index
The UNEP aridity index (P/PET) from 85 years of ERA5 climatology — hyper-arid through humid on one dimensionless scale, with a per-pixel confidence interval. A byproduct of the drought v2 hazard chain, shipped at honest ERA5-native resolution. The whole bundle is ~2 MB.
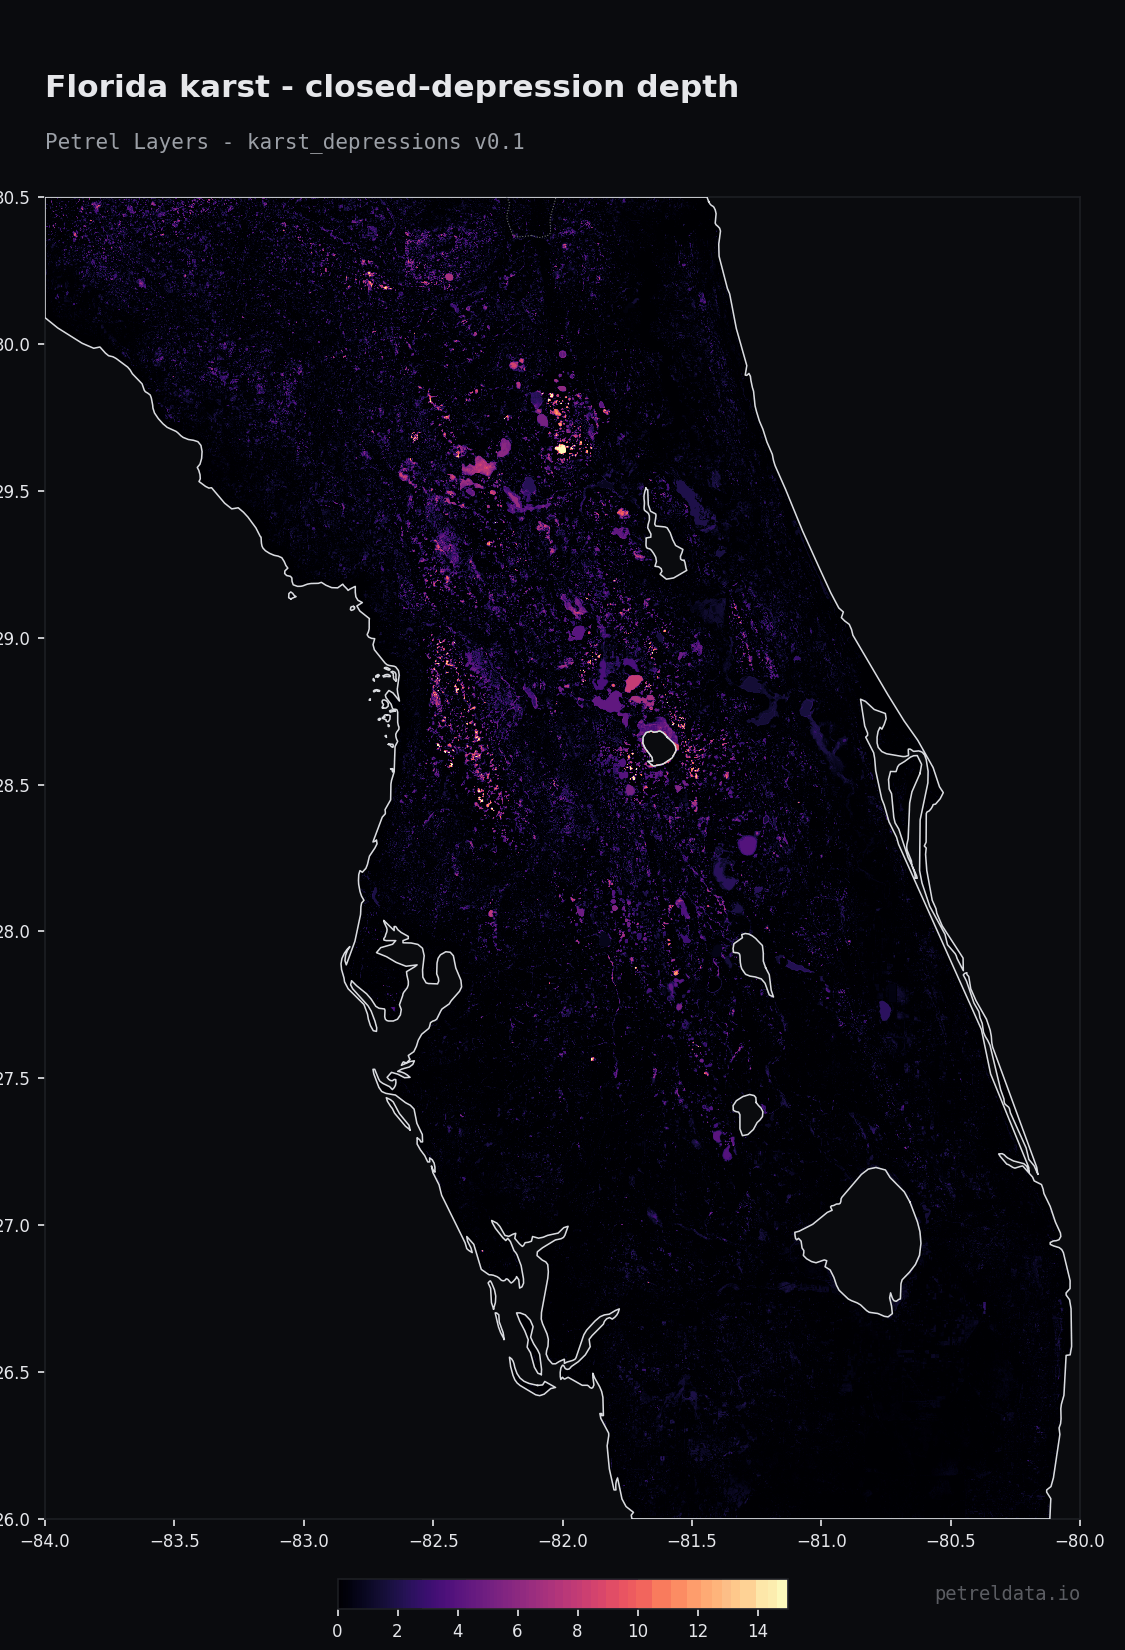
Karst & Depressions
Two measured surfaces a sinkhole assessment would want as inputs — deliberately not a sinkhole probability. Measured in Florida, depression depth scores AUC 0.649 [0.58, 0.71]: 51% of verified sinkholes sit in a closed depression against 24% of confirmed non-sinkholes. Validation is Florida-only, and Florida is atypical karst (sand over carbonate). ⚠ The brightest terrain in the depth band is endorheic basins, not karst — interpret regionally, never globally.
Flow Accumulation
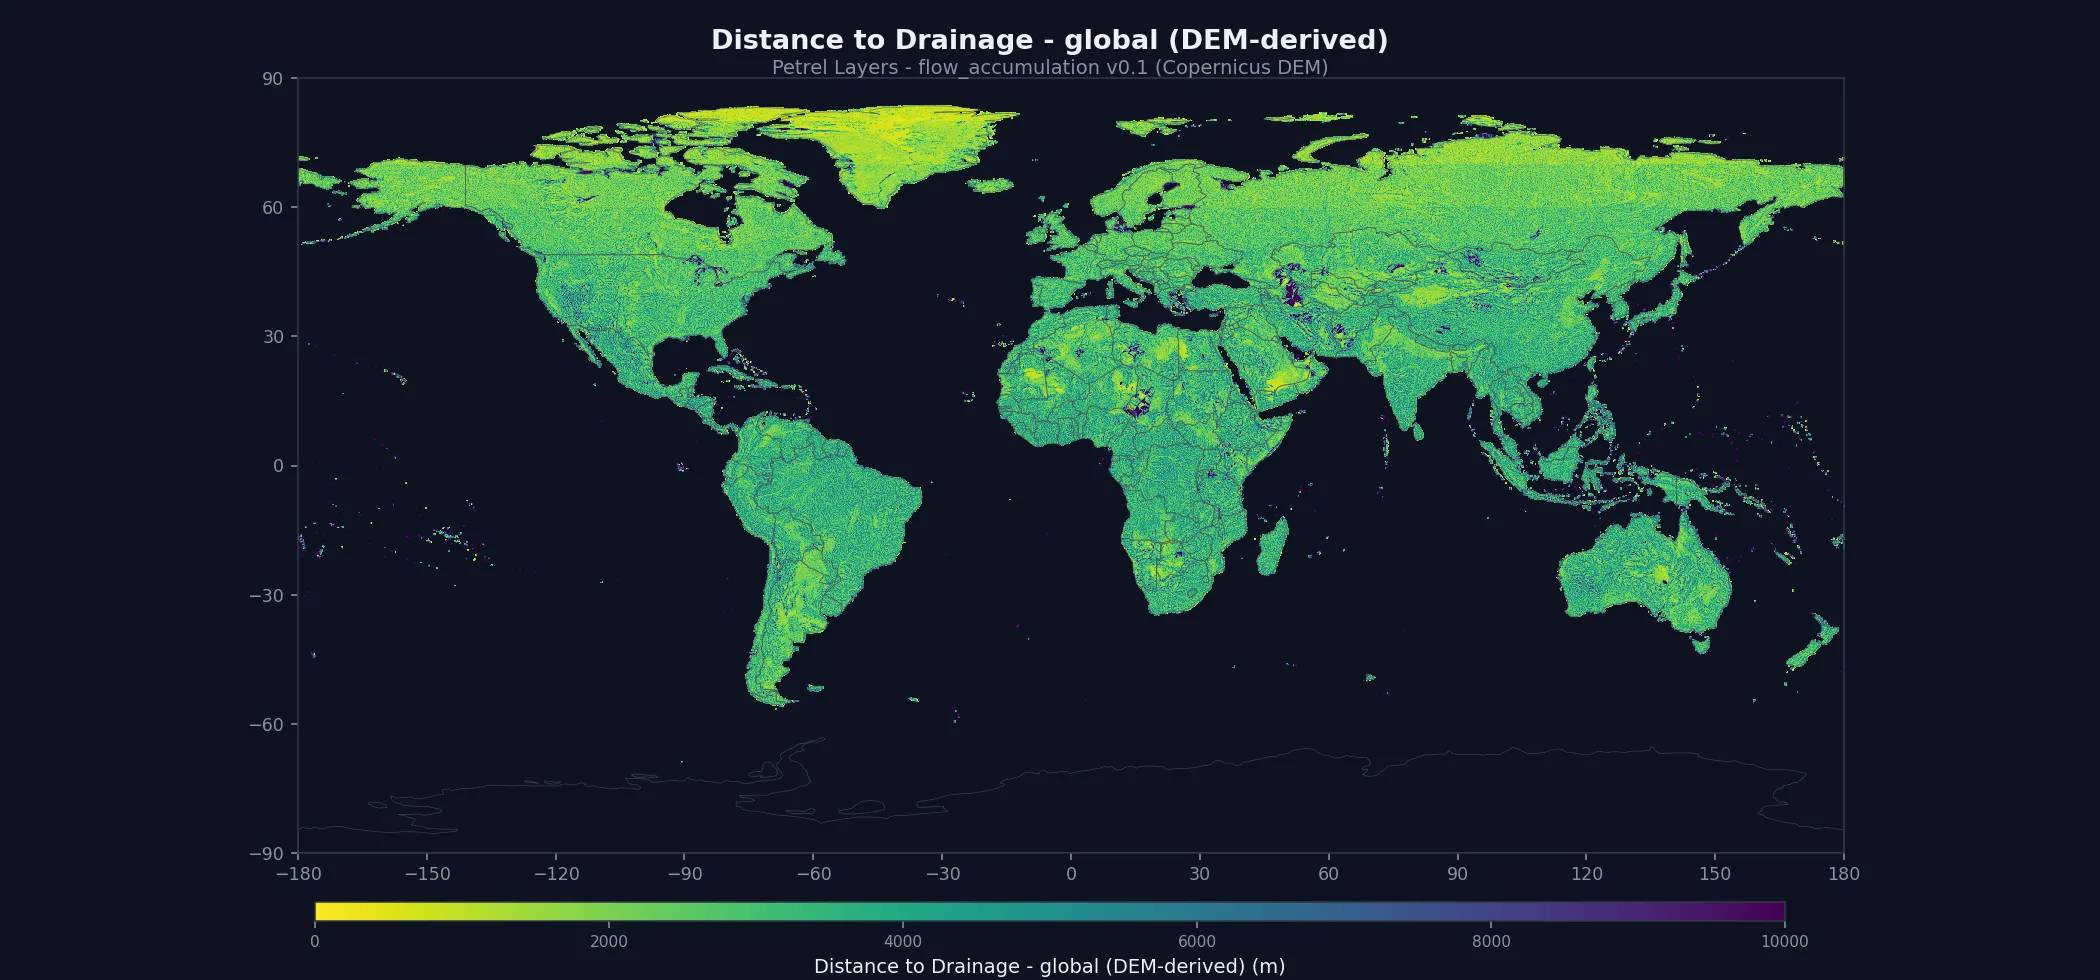
A free drainage dataset for the community: distance-to-drainage and TWI at 278 m, derived from the open GEDTM30 bare-earth DEM — so it reaches your stack with no copyleft strings or flow-down obligations (CC-BY-NC; the CC-BY inputs are credited in the bundle). The same layers feed the Petrel landslide, soil-erosion, flood and lahar chains. v0.3 is QUANTITATIVELY validated: upslope area is now reconciled across tile seams, so basin capture at nine gauged outlets reads 90.0–100.4% of published upstream area (Amazon 99.8%, Mississippi 99.4%, Ganges 100.3%, Volga 100.4%) against 2.5–19.3% in v0.1. ⚠ Known limits: the flattest basins still under-count (Ural 90.0%, Amu Darya 94.3%); the v0.1 TWI low bias on major basins is resolved (the residual implied by remaining basin-capture shortfall is under 0.11 units), but TWI is capped at 35 and that ceiling is reached: 0.13% of land cells overall, and 12.9% of cells carrying more than 1000 km² of drainage (Volga 22.9%, almost all inside reservoir surfaces, which are flat and saturate by construction) — where the magnitude of drainage matters, read contributing area rather than TWI; distance saturates at 50 km on islands too small to contain a modelled channel (118 km² globally), where the value means “no modelled channel on this land” rather than a distance; and lakes outside the eight Volga/Kama reservoirs keep DEM routing, so a large lake’s modelled outlet may not be the real one.
Roadmap
Layers we plan to release as the hazard catalog expands. Each answers a covariate or input gap the team has hit while building a downstream hazard.
How to access
- Create a free Petrel account — email verification only, no card required.
- Generate an API key from your account settings.
- Hit the Layer endpoint:
GET /v1/layer/<name>/<vintage>/bundle— returns a 1-hour signed download URL. - See the API documentation for code samples in curl, Python, and R.
License: CC-BY-NC-4.0. Free for academic, research, and other non-commercial use. For commercial licensing, contact petreldata.io@gmail.com.