
Planetary risk,
resolved.
A calibrated 0–1 hazard score for every peril, every place on Earth — at ninety-meter native resolution. The first catalog where landslide, wildfire, and earthquake risk are all on the same scale, with the same methodology rigor, so cross-peril comparisons actually mean something. Ten live, fourteen on the public roadmap.
Ten live.
The rest, mid-build.
Each peril is a calibrated 90 m global hazard surface, modeled with the method that fits its physics — supervised ML where event inventories support it, Gumbel/GEV extreme-value statistics for return-period perils, process models for soil and seismic. Every model versioned, every score audit-ready, every release stamped with per-pixel uncertainty and coverage layers.
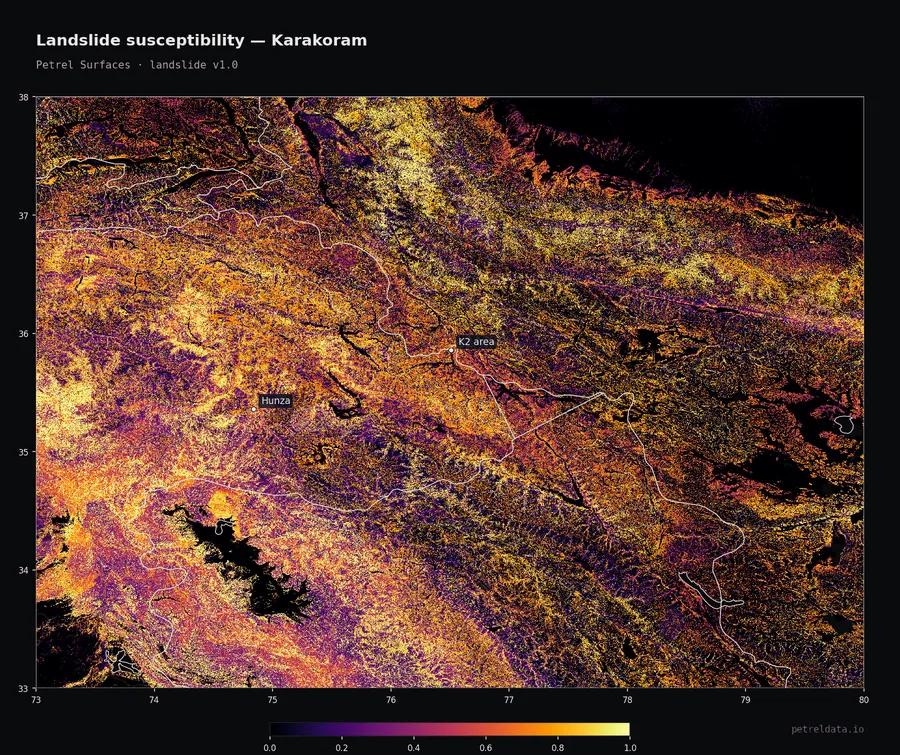
Landslide
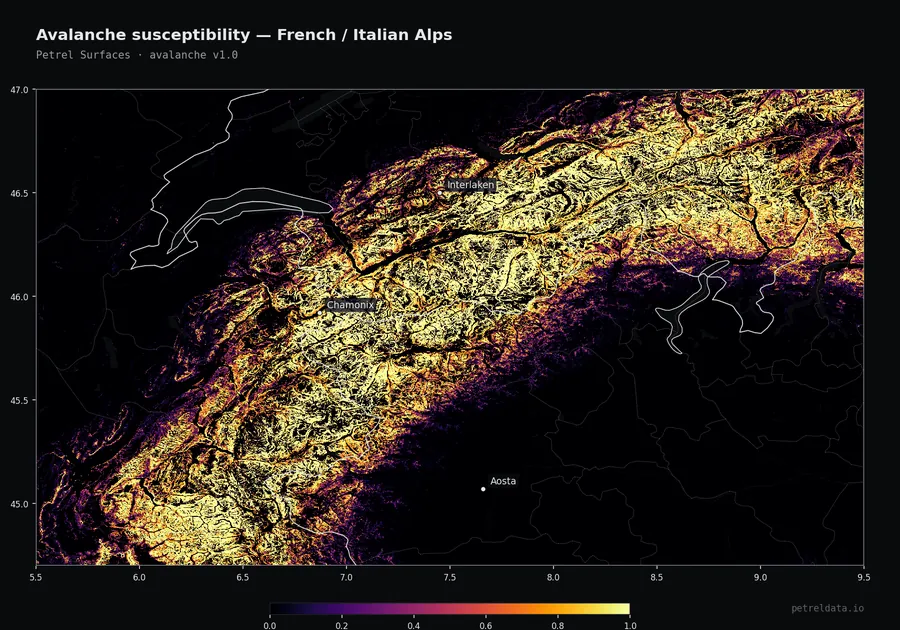
Avalanche
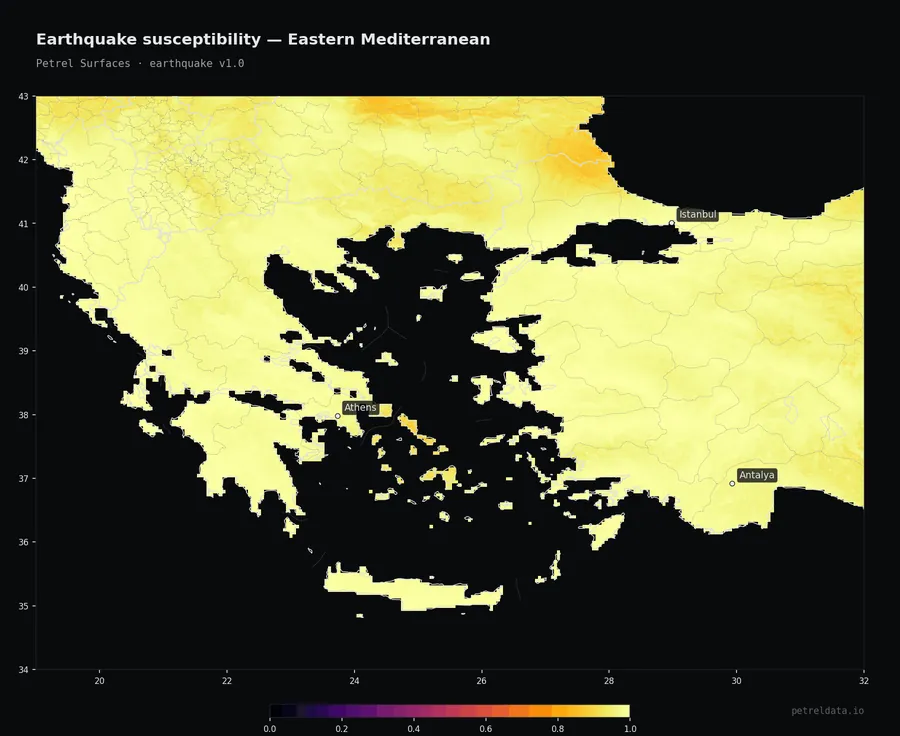
Earthquake
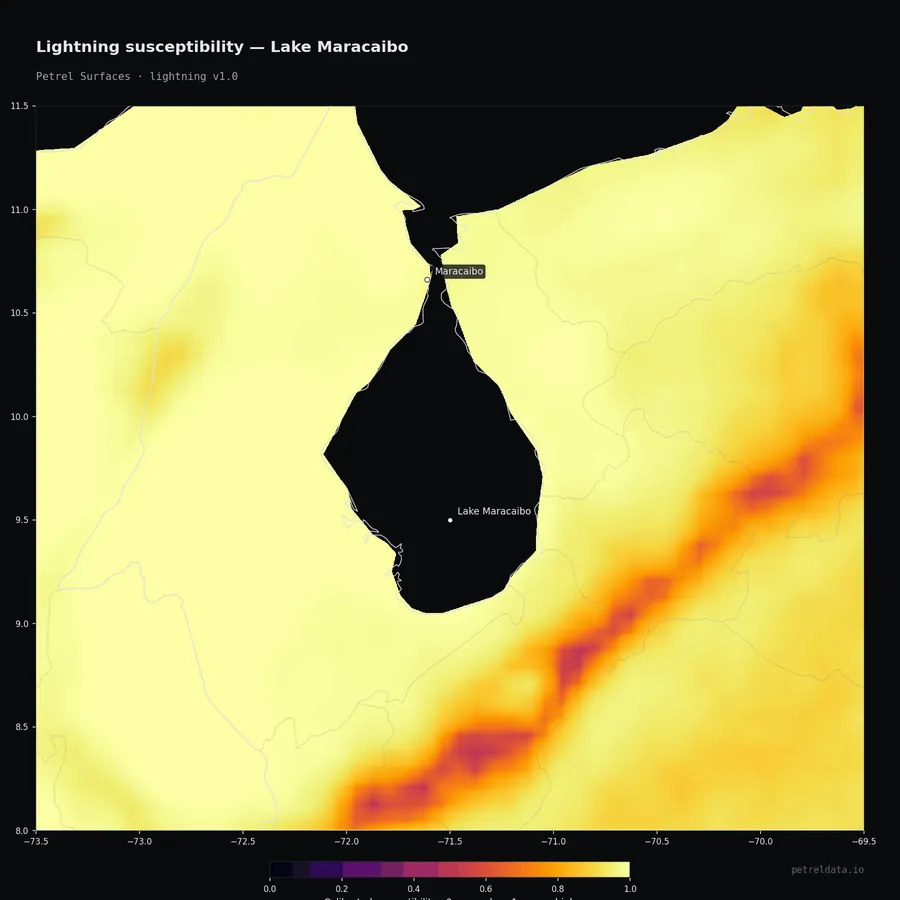
Lightning
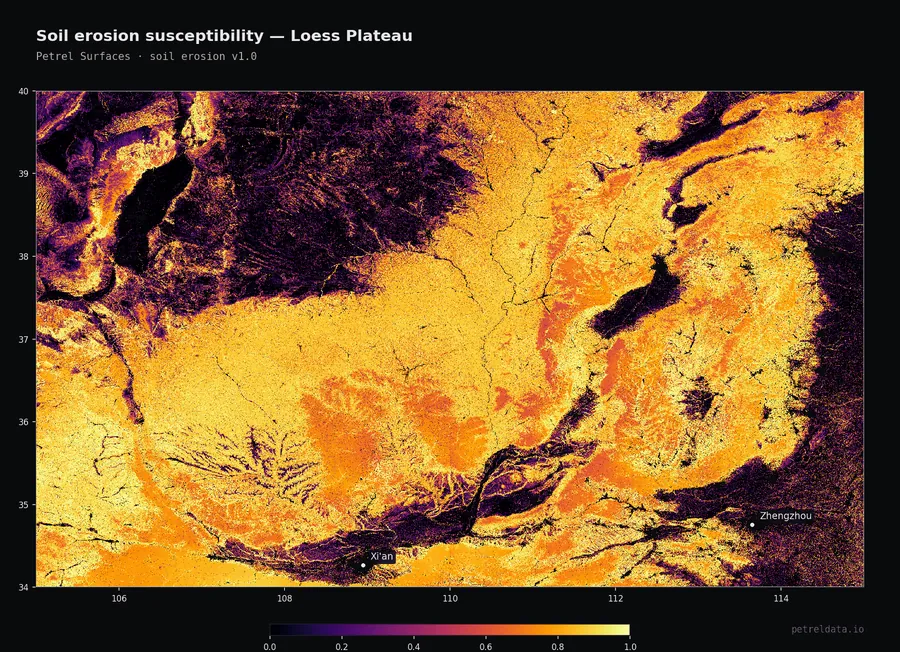
Soil erosion
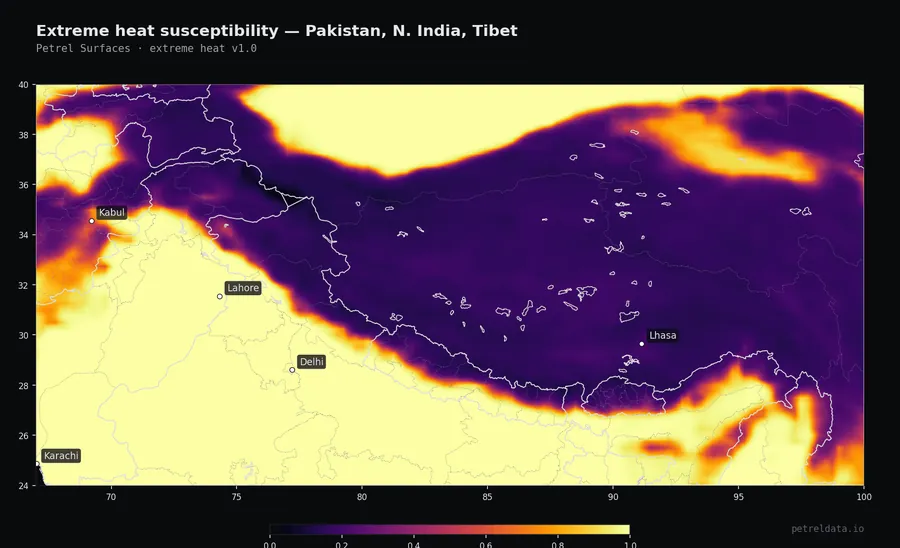
Extreme heat
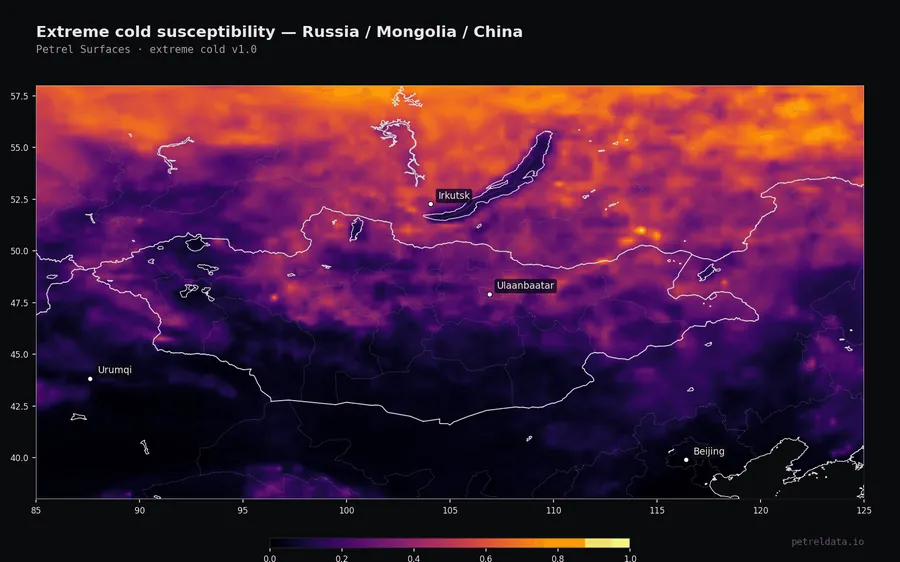
Extreme cold
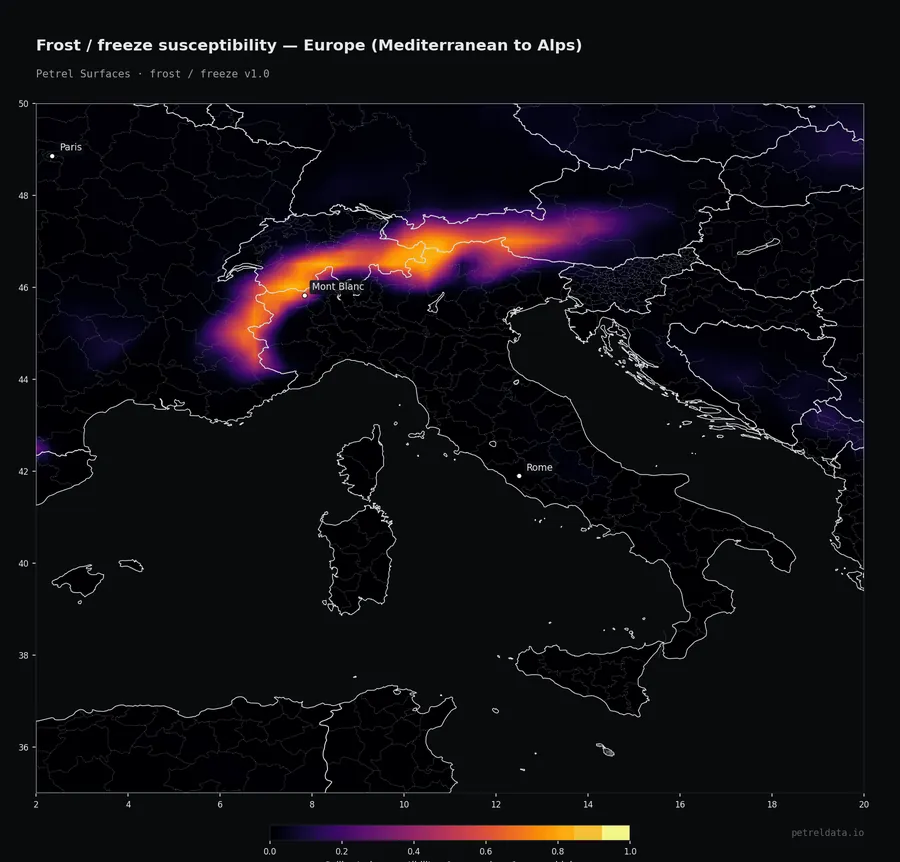
Frost / freeze
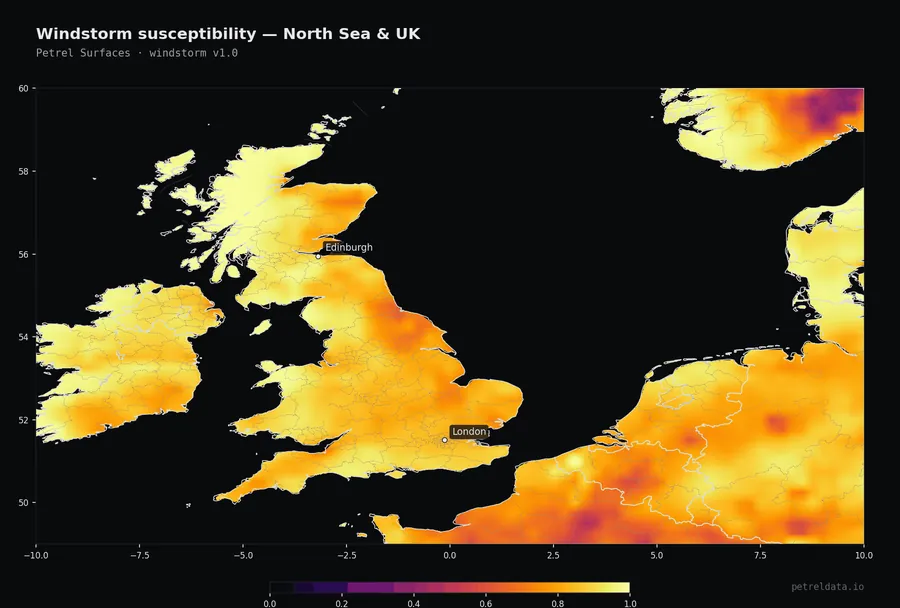
Windstorm
Wildfire
Pick a place.
Read its risk.
Every bar is a real Petrel score for a single 90 m pixel — the landmark itself, not the city around it. Nine perils on one calibrated 0–1 scale: the cross-peril comparison no single-peril vendor can show you, at a resolution that resolves one building from the next. The hosted point-query API runs this for any address or portfolio.
Built for scale,
engineered for decisions.
Petrel is the infrastructure layer beneath site selection, climate disclosure, and underwriting triage — three workflows where a comparable 0-to-1 score across hazards beats a return-period curve. Query any point, parcel, or portfolio — anywhere on Earth.
Ninety meters. Everywhere.
A single global raster per hazard, aligned to a common grid, with no coverage gaps between nations, oceans, or climate zones. EPSG:4326. 90 m native.
Traceable to the pixel.
Every score ships with a per-pixel uncertainty layer, an input-data coverage mask, a STAC item, and a methodology document. Versioned per release. Audit-ready for regulators — every input source, every modeling choice, every validation cohort is in the public methodology.
Sample, query, or bulk.
Free sample COGs for every live peril at data.petreldata.io — pull with curl, open in QGIS, no signup. Hosted point-query API (Stripe-metered) for single addresses and portfolios — in private beta, request early access. Full bulk vintage downloads for enterprise customers via sales.
One comparable
scale.
Most decisions about a site, a portfolio, or a regulator filing don't need an event set — they need a comparable score across hazards. Petrel Surfaces ships exactly that: a calibrated 0–1 score per peril, every place on Earth, on one scale that compares cross-peril and cross-portfolio.
Global hazard susceptibility.
A calibrated 0–1 score per peril, 90 m native resolution, every place on Earth. Same calibration philosophy across all 24 perils, so scores compare cross-peril and cross-portfolio without re-normalization. Per-pixel uncertainty and input-coverage layers ship with every release. Ten hazards live today: landslide, avalanche, earthquake, lightning, soil erosion, extreme heat, extreme cold, frost/freeze, windstorm, wildfire. Fourteen more on the roadmap.
Where it sits: global where JBA and Fathom are single-peril; 90 m where Climate X and Cervest run kilometer-scale composites; open methodology and per-pixel uncertainty where the disclosure incumbents ship a black-box score.
For: mid-market underwriters & MGAs running submission triage · treaty reinsurers pre-filtering cessions · TCFD / ISSB / CSRD disclosure · real-estate & infrastructure due diligence · site-selection consultants · corporate location-strategy teams.
Return-periods & event sets.
For the perils where insurers price by return period, the same calibrated hazard physics behind Surfaces produces return-level intensities in native units (m/s, °C). Per-pixel return-period rasters and stochastic event catalogs with AAL roll-ups are on the roadmap.
For: primary insurers and reinsurers running event-set workflows —talk to us about early access.
A physics-informed
learning substrate.
Each surface uses the right tool for the peril — supervised ML where inventories support it, extreme-value statistics where the physics is stationary, and process models where neither applies. Every method is spatially cross-validated and calibrated to a 0–1 score. The result is a single, versioned 90 m raster per hazard, per release.
- I.Observational fusionCopernicus DEM 30 m, ESA WorldCover 10 m, Copernicus Global Land Cover, SoilGrids 250 m, ERA5 monthly extremes 1991–2020, NOAA IBTrACS, NASA FIRMS, MODIS NDVI + burn-area, Potapov canopy height, GEM seismic, HydroSHEDS, WGLC lightning, OpenStreetMap.
- II.Right model, by hazardGradient-boosted classifiers with spatially blocked cross-validation where event inventories support it (landslide, avalanche, wildfire); Gumbel/GEV extreme-value statistics for return-period perils (windstorm, heat, cold); RUSLE for soil erosion; ECDF percentile-rank for cross-hazard normalization; site-amplified PGA for earthquake.
- III.Per-pixel uncertainty and coverageEvery release ships an uncertainty layer with each score — bootstrap ensemble standard deviation for ML hazards, closed-form delta-method standard error for the Gumbel/GEV physics hazards — plus an input-data coverage mask.
- IV.Validated against ground truthSpatially blocked hold-out AUC for the supervised hazards: mean 0.97 across landslide (0.97 on 80K+ events), avalanche (0.99), and wildfire (0.94 on 7M+ FIRMS active-fire pixels, envelope-matched negatives). Physics hazards validated against GEM, NOAA storm records, and station-based extremes.
Free samples now.
API + bulk soon.
One ~5°×5° sample per live peril is on the public CDN today — pull with curl, open in QGIS, no signup. The hosted point-query API (Stripe-metered, pay per request) is in private beta — request early access. Full bulk vintage downloads for enterprise customers are sold through sales.
import rasterio

# Free public sample — no API key, no signup.
# Full vintage downloads are sold through sales.

URL = "https://data.petreldata.io/samples/landslide_karakoram_90m.tif"

lon, lat = 76.513, 35.862  # K2 area

with rasterio.open(URL) as cog:
    score = next(cog.sample([(lon, lat)]))[0]

print(f"landslide susceptibility: {score:.3f}")
# → landslide susceptibility: 0.873

# Point-query API (private beta, Stripe-metered):
# curl -H "X-API-Key: tlk…" api.petreldata.io/v1/score?lon=…&lat=…

The next decision you make
about the planet — make it with Petrel.
For underwriters, disclosure officers, and site-selection teams. Wherever the next decision needs a comparable score, on a global grid.