
Planetary risk,
resolved.
A calibrated 0–1 hazard score for every peril, every place on Earth — at ninety-meter native resolution. The first catalog where landslide, wildfire, and earthquake risk are all on the same scale, with the same methodology rigor, so cross-peril comparisons actually mean something. Sixteen live, nine on the public roadmap.
Sixteen live.
The rest, mid-build.
Each peril is a calibrated 90 m global hazard surface, modeled with the method that fits its physics — supervised ML where event inventories support it, Gumbel/GEV extreme-value statistics for return-period perils, process models for soil and seismic. Every model versioned, every score audit-ready, every release stamped with per-pixel uncertainty and coverage layers.
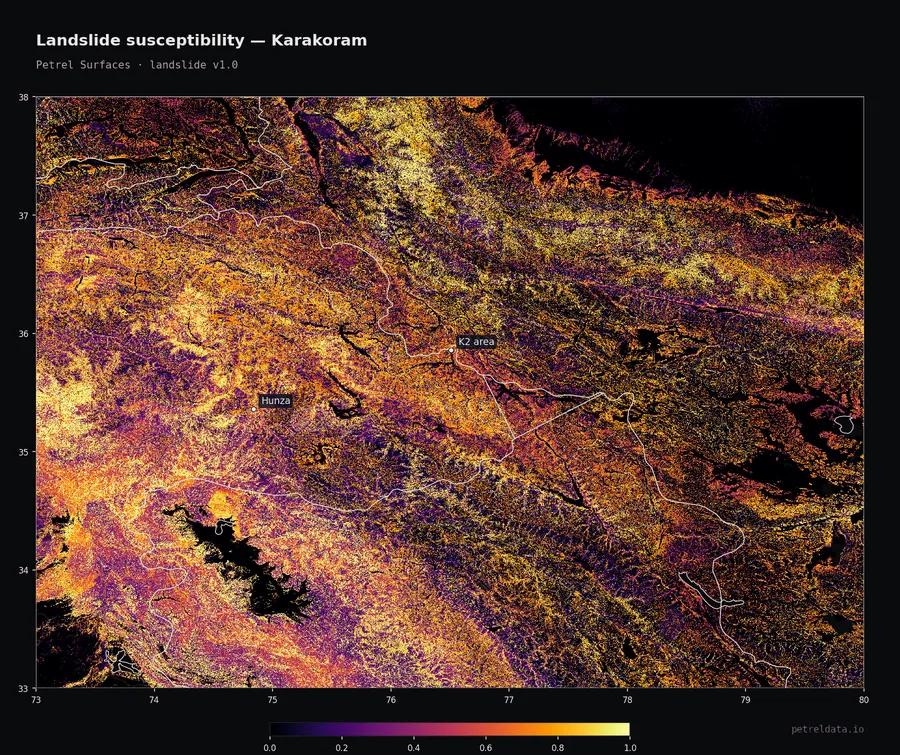
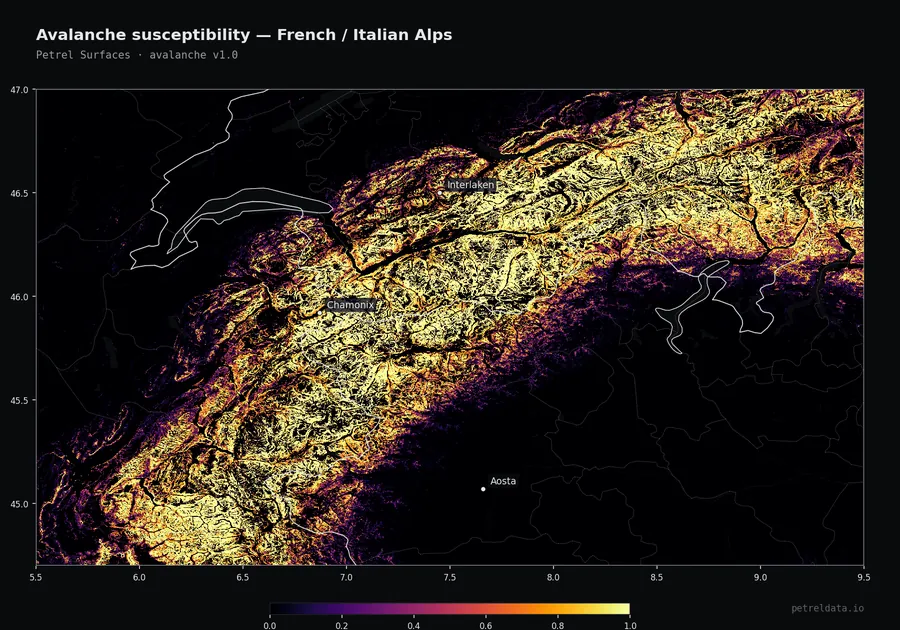
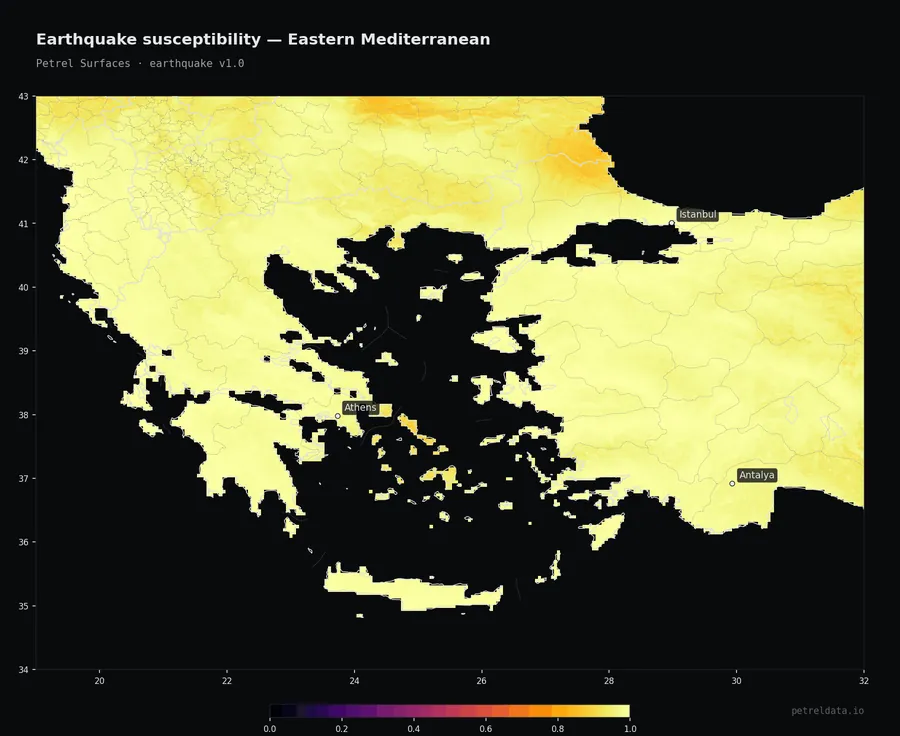
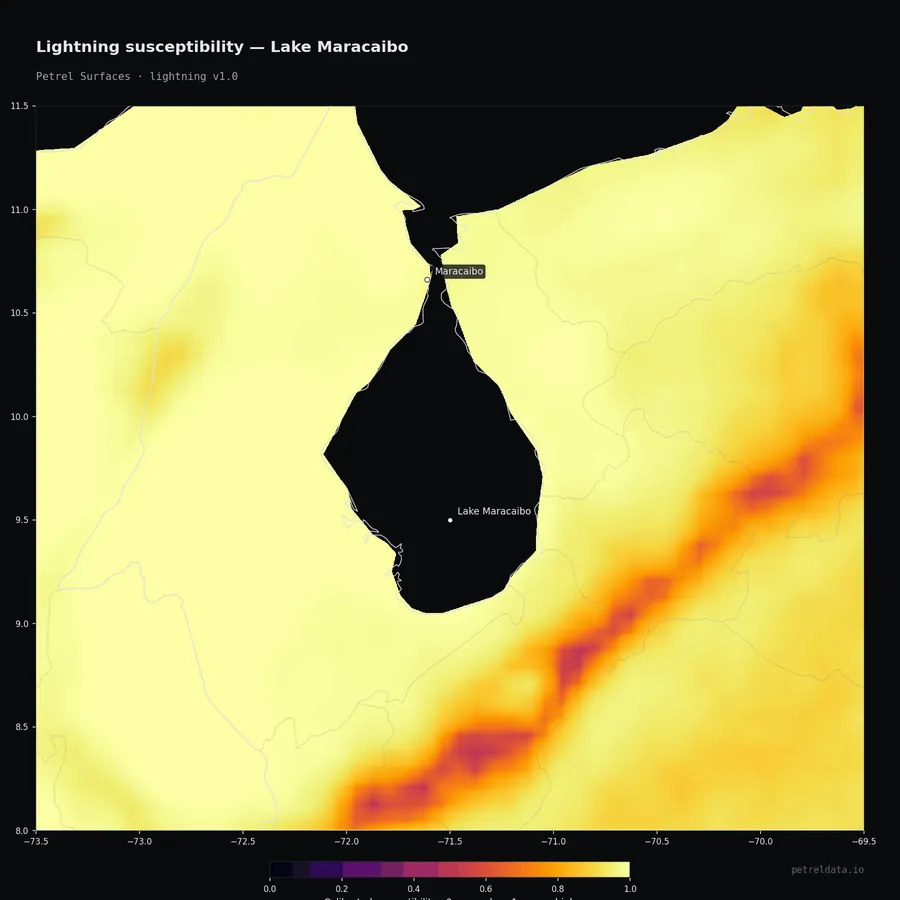
Pick a place.
Read its risk.
Every number is real, sampled at a single 90 m pixel — the landmark itself, not the city around it. Two product lines, two questions: Surfaces scores how prone this exact pixel is, every peril on one calibrated 0–1 scale. Returns answers how bad it gets — the severity you should expect once in 5 to 500 years. The hosted API runs both for any address or portfolio.
Built for scale,
engineered for decisions.
Petrel is the infrastructure layer beneath site selection, climate disclosure, and underwriting triage — three workflows where a comparable 0-to-1 score across hazards beats a return-period curve. Query any point, parcel, or portfolio — anywhere on Earth.
Ninety meters. Everywhere.
A single global raster per hazard, aligned to a common grid, with no coverage gaps between nations, oceans, or climate zones. EPSG:4326. 90 m native.
Traceable to the pixel.
Every release ships with a per-pixel uncertainty layer, an input-data coverage mask, a STAC item, and a methodology document. Versioned per release. Audit-ready for regulators — every input source, every modeling choice, every validation cohort is in the public methodology.
Sample, query, or bulk.
Free sample COGs for every live peril at data.petreldata.io — pull with curl, open in QGIS, no signup. Hosted point-query API (Stripe-metered) for single addresses and portfolios — self-serve, free tier, no card. Full bulk vintage downloads for enterprise customers via sales.
One comparable
scale.
Most decisions about a site, a portfolio, or a regulator filing don't need an event set — they need a comparable score across hazards. Petrel Surfaces ships exactly that: a calibrated 0–1 score per peril, every place on Earth, on one scale that compares cross-peril and cross-portfolio.
Global hazard susceptibility.
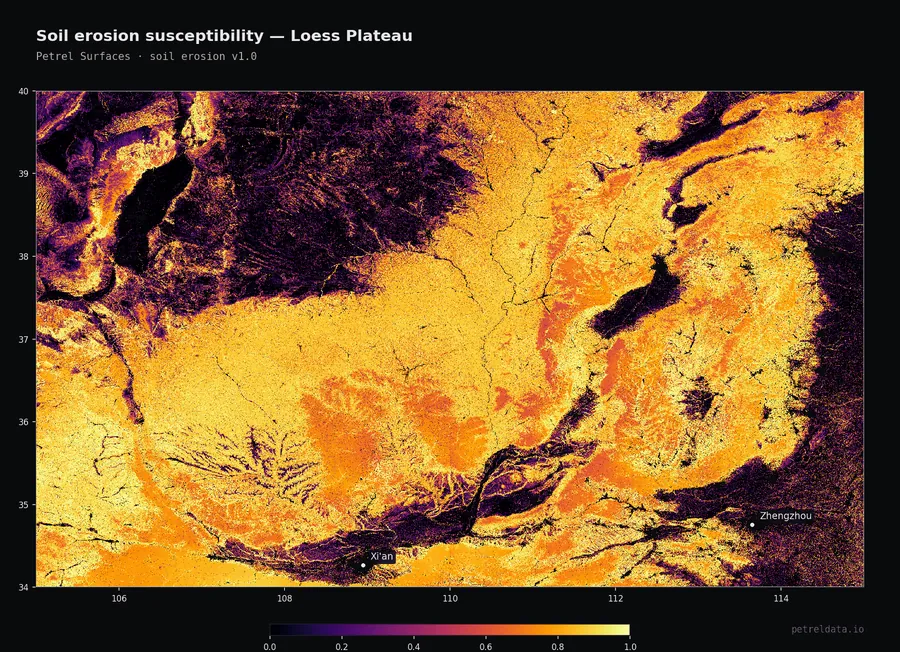
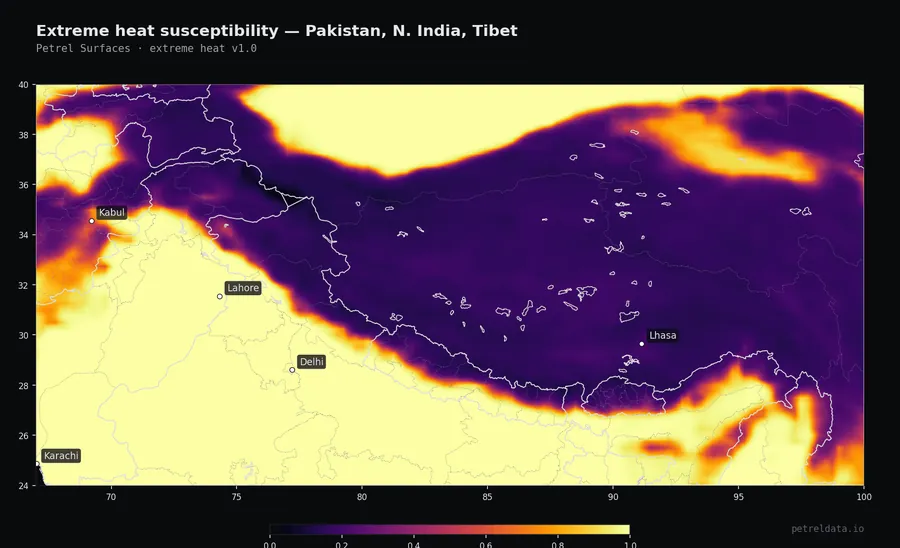
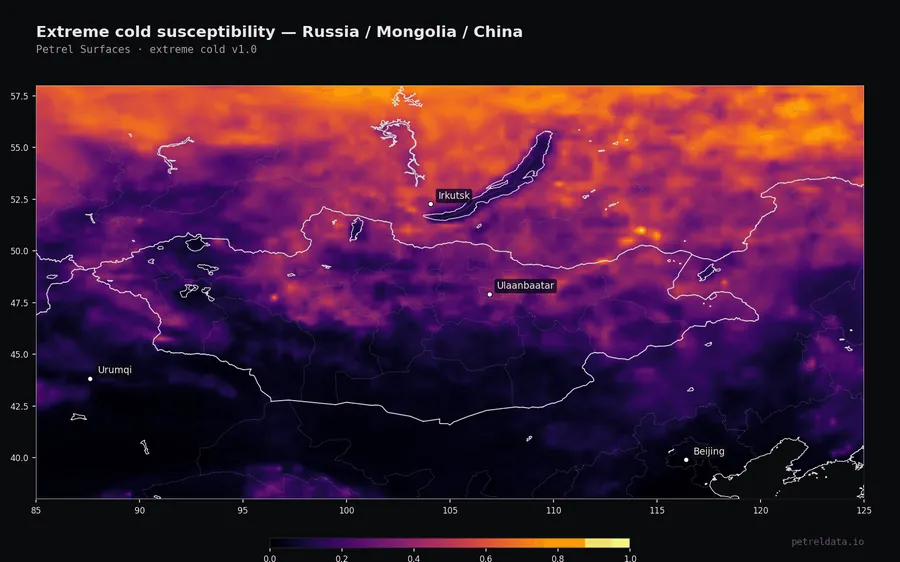
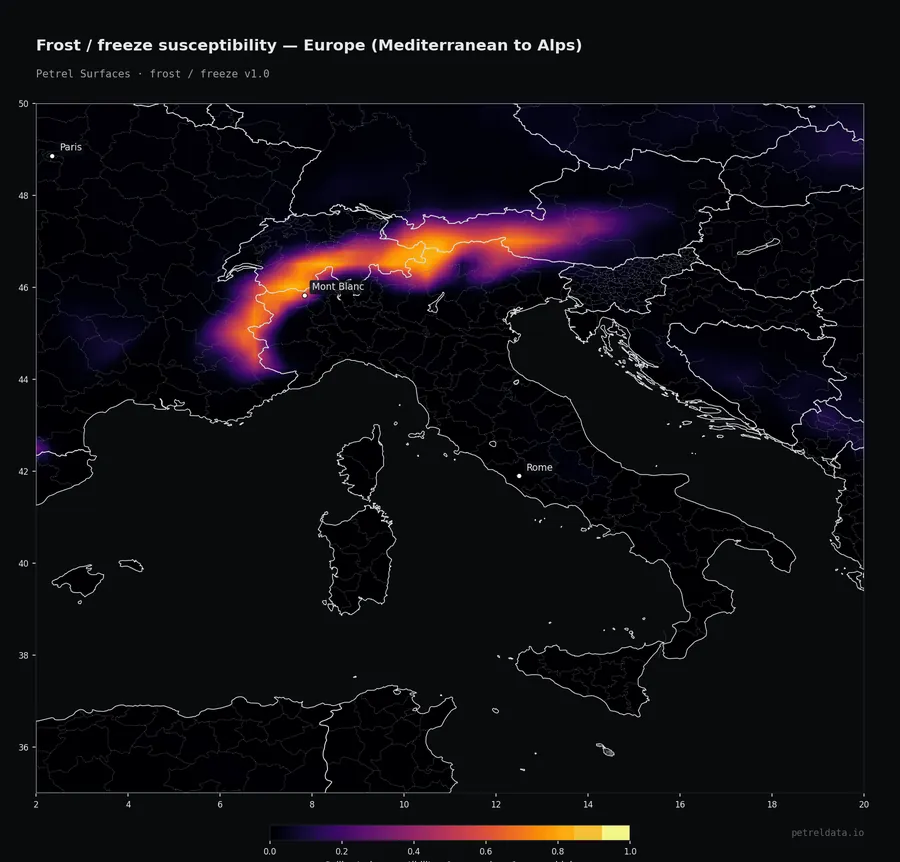
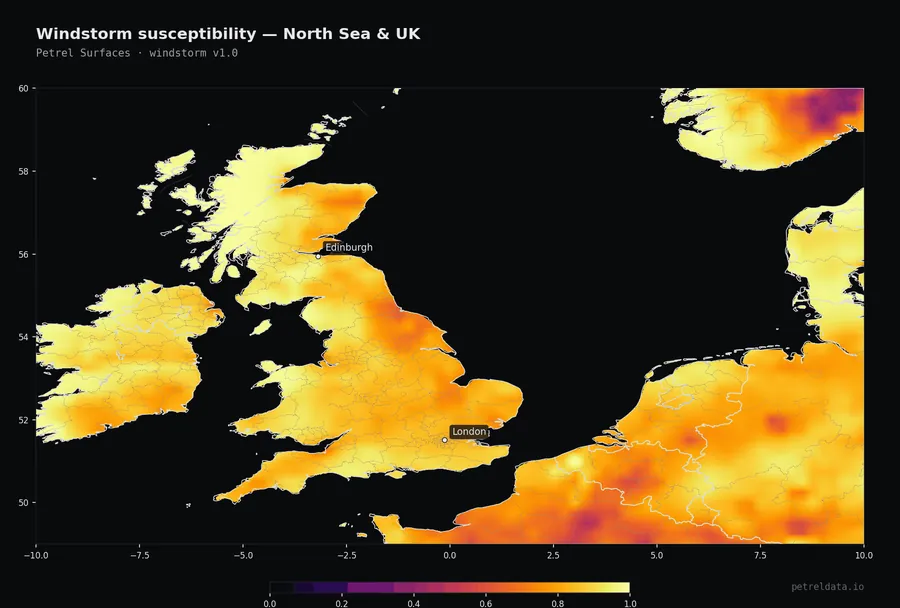
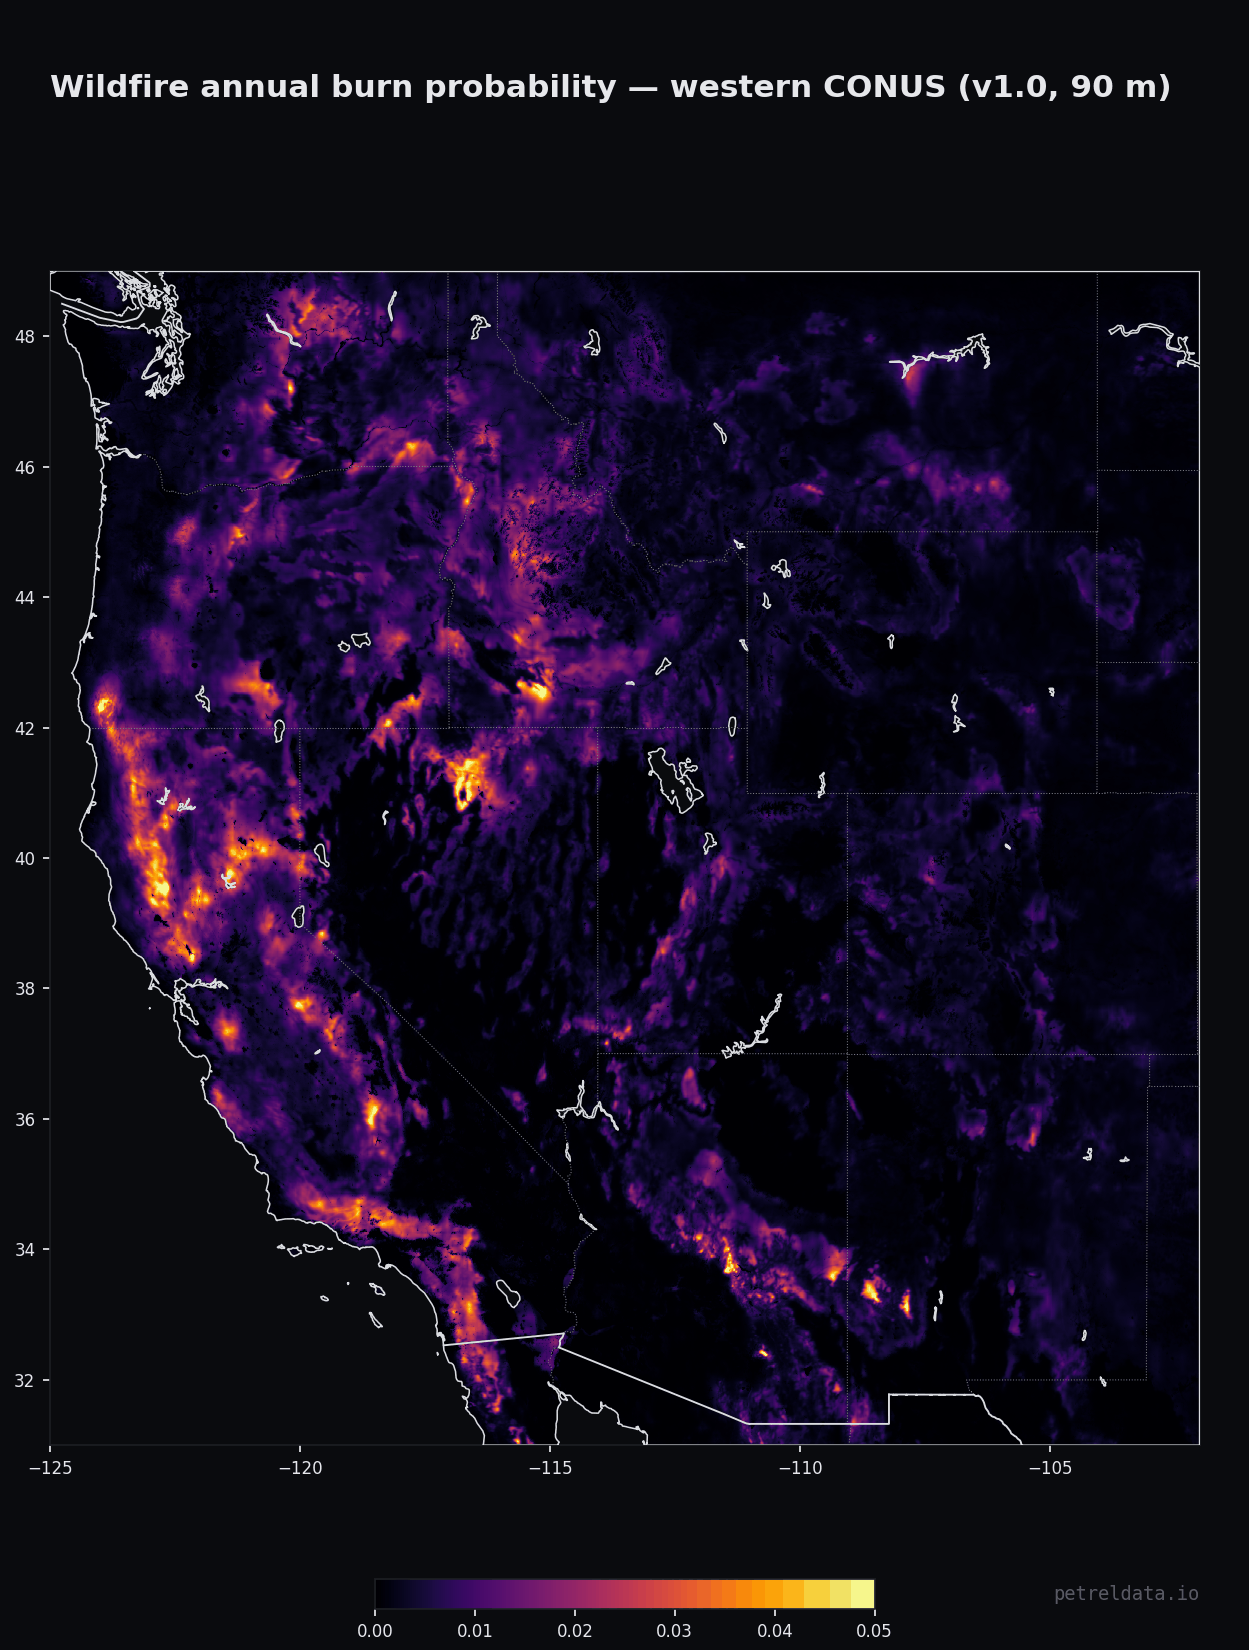
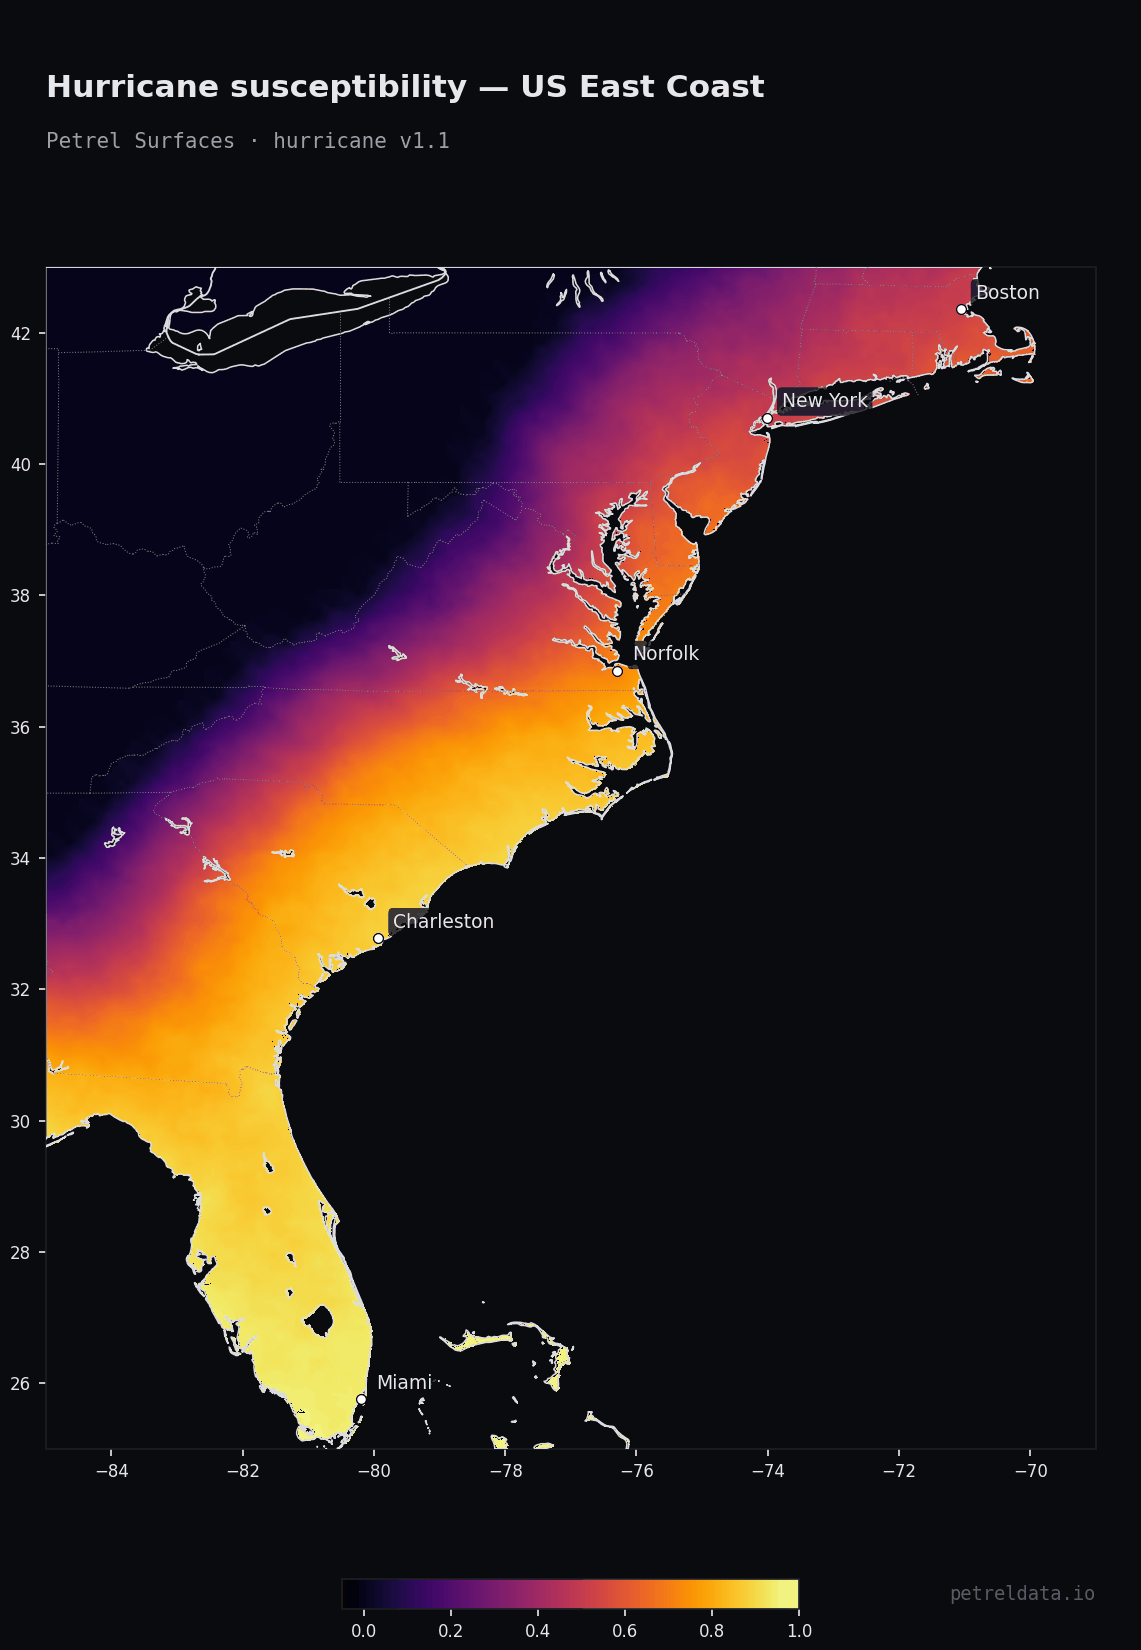
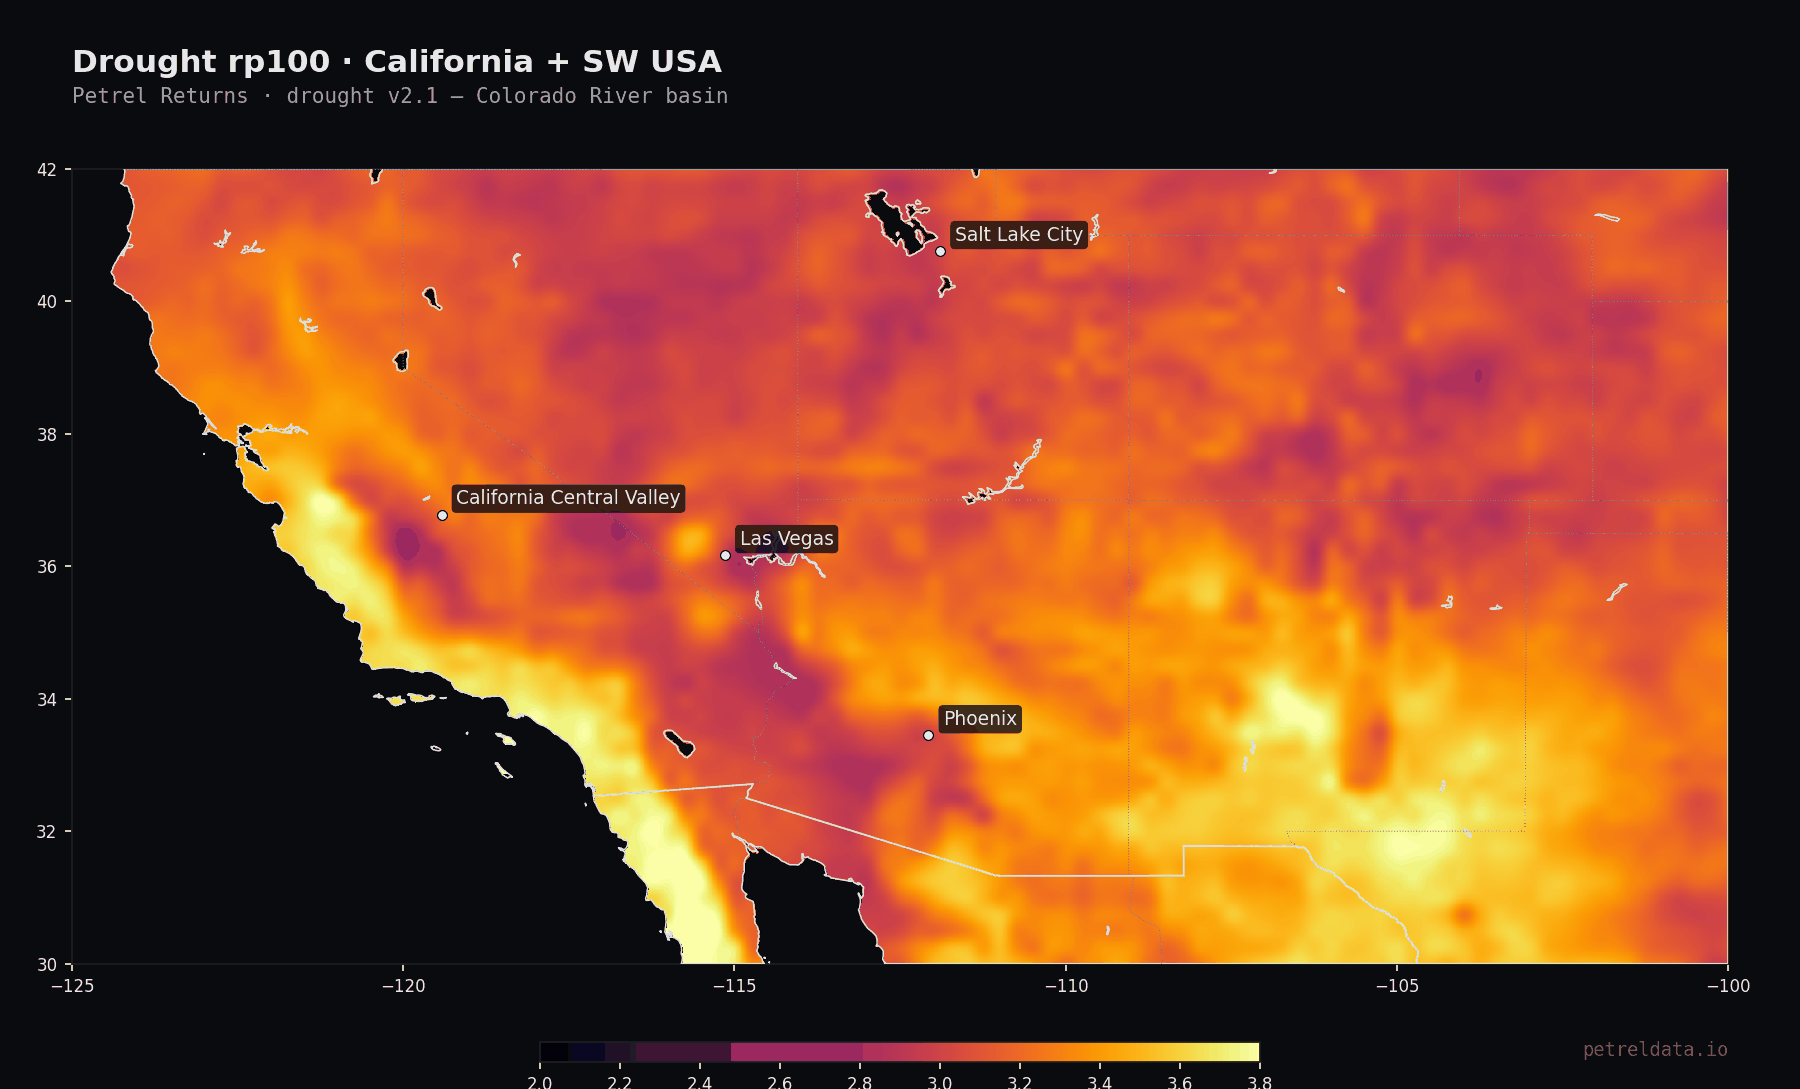
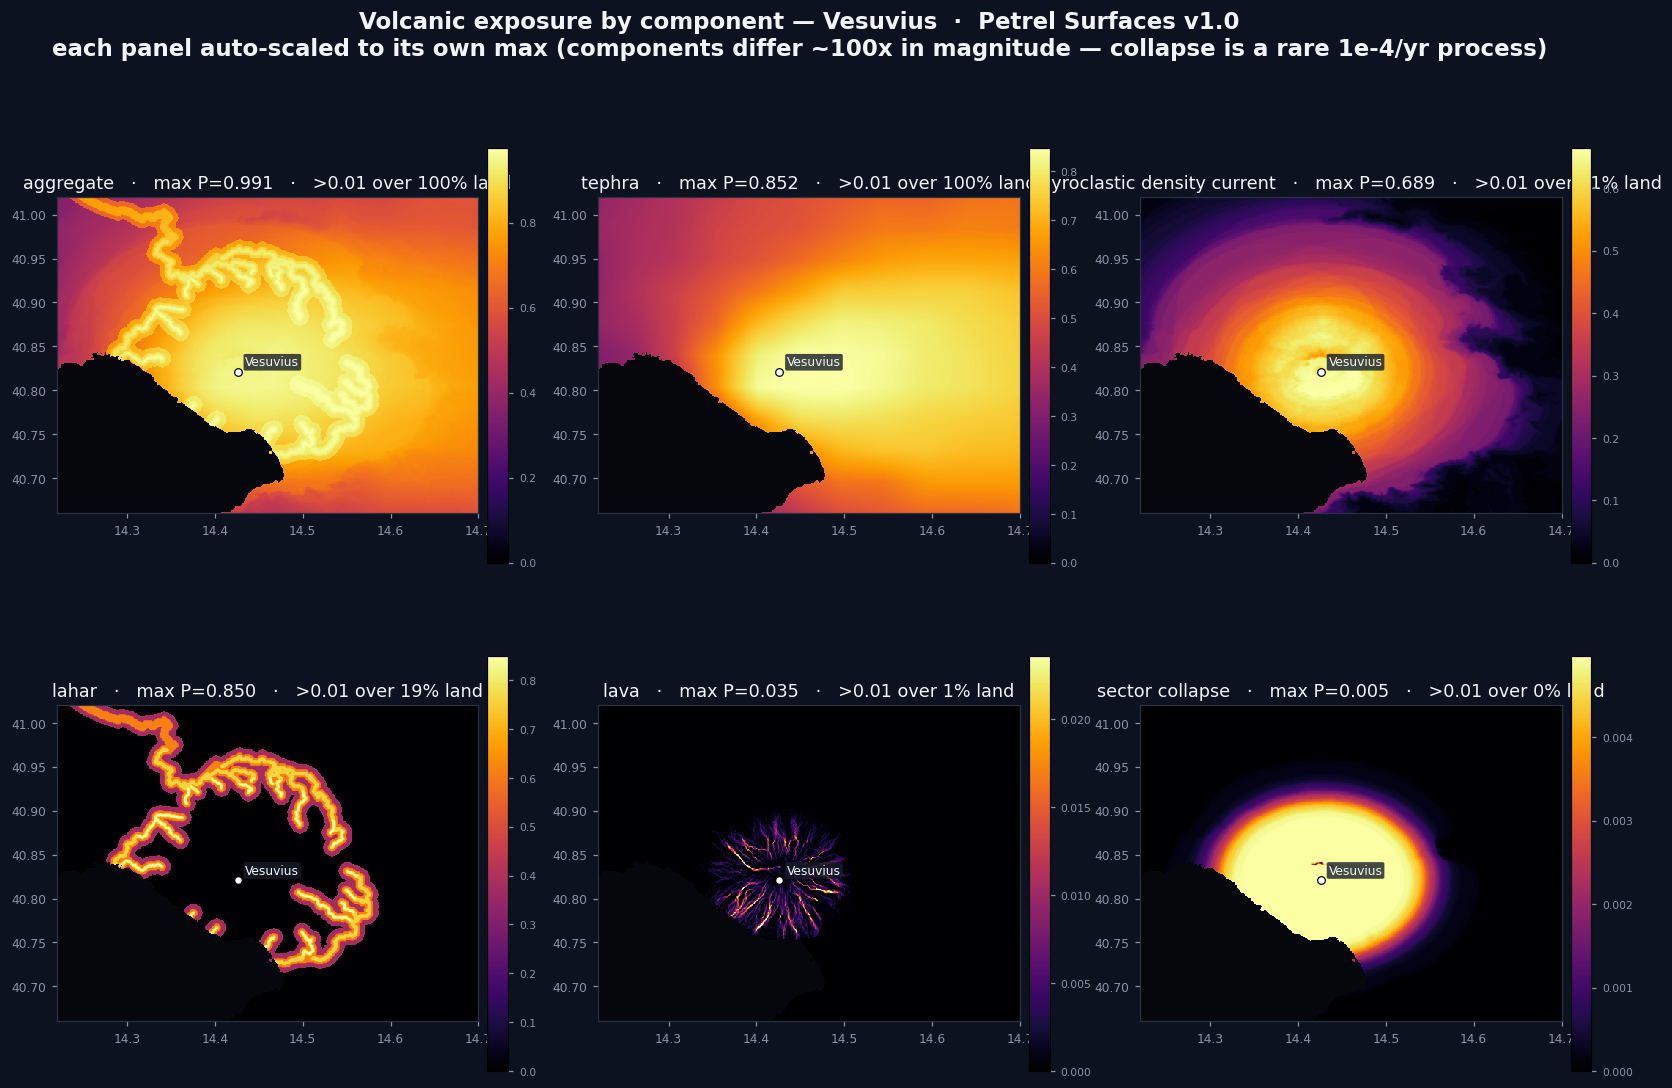
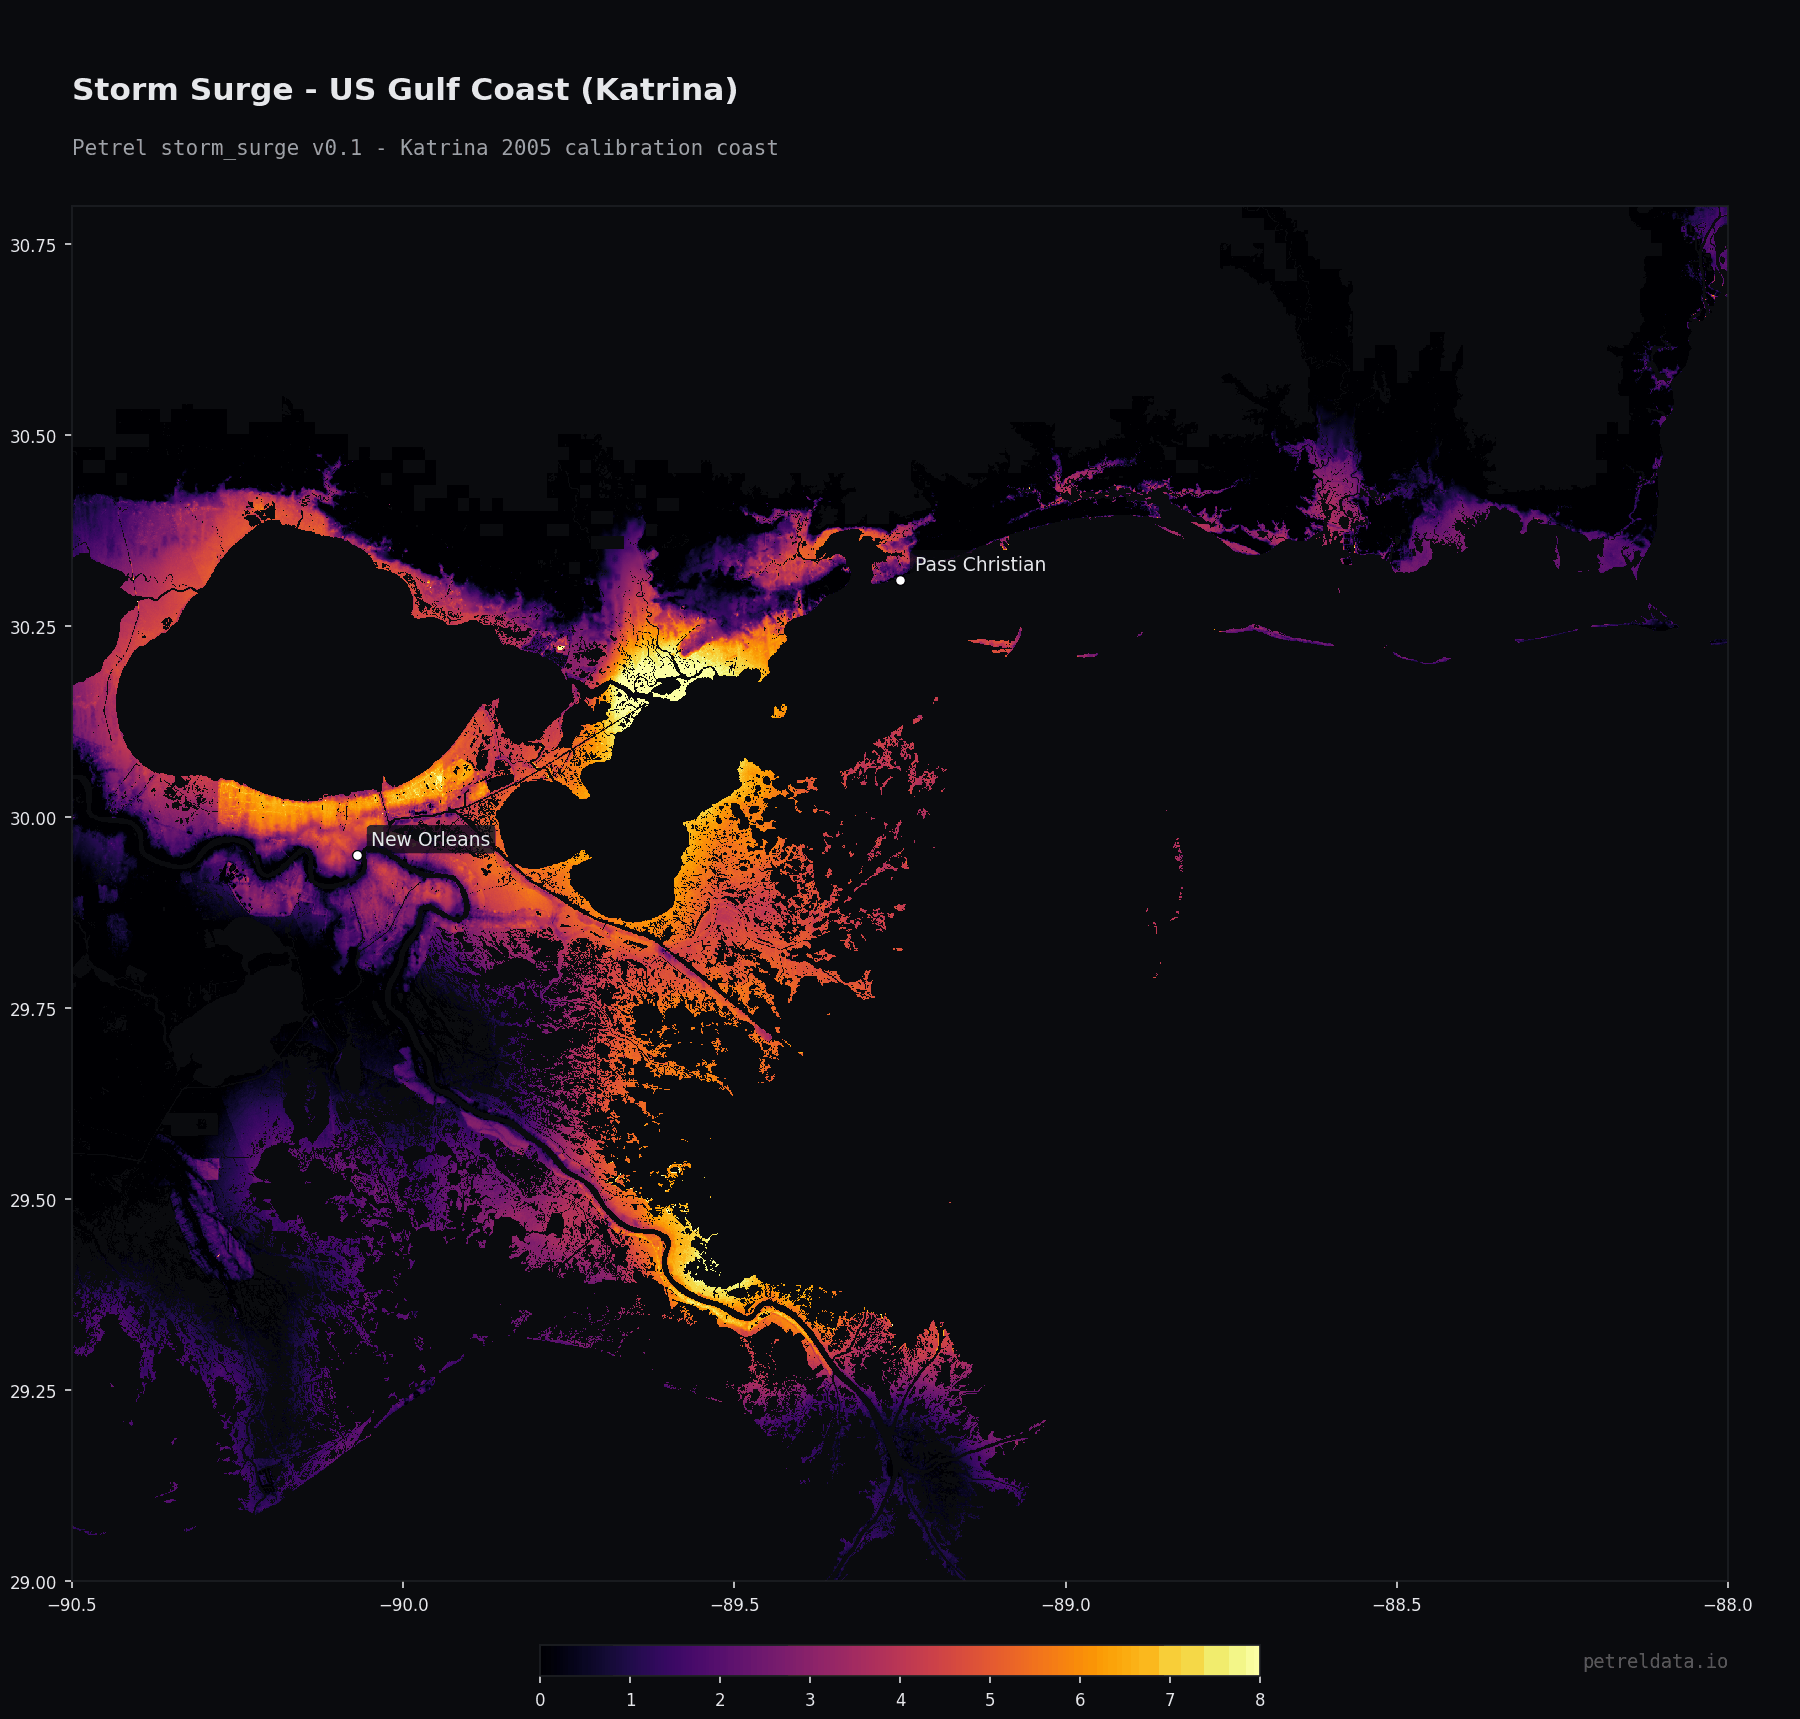
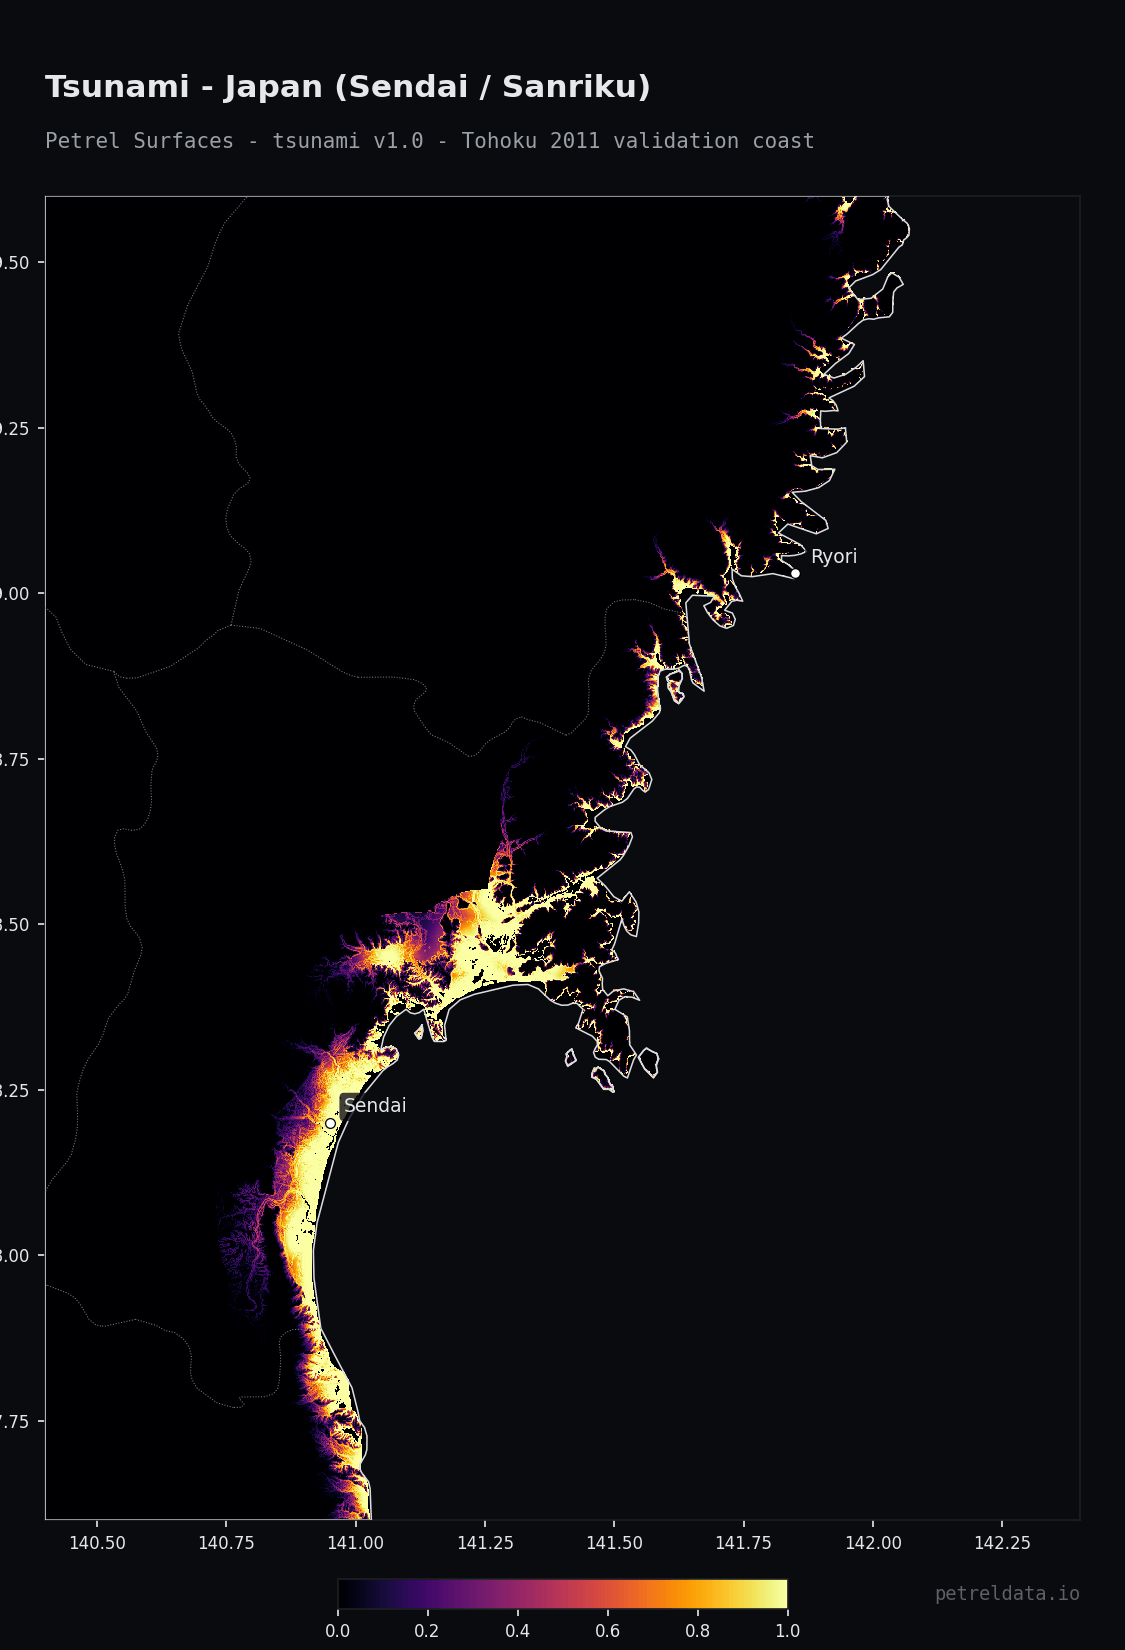
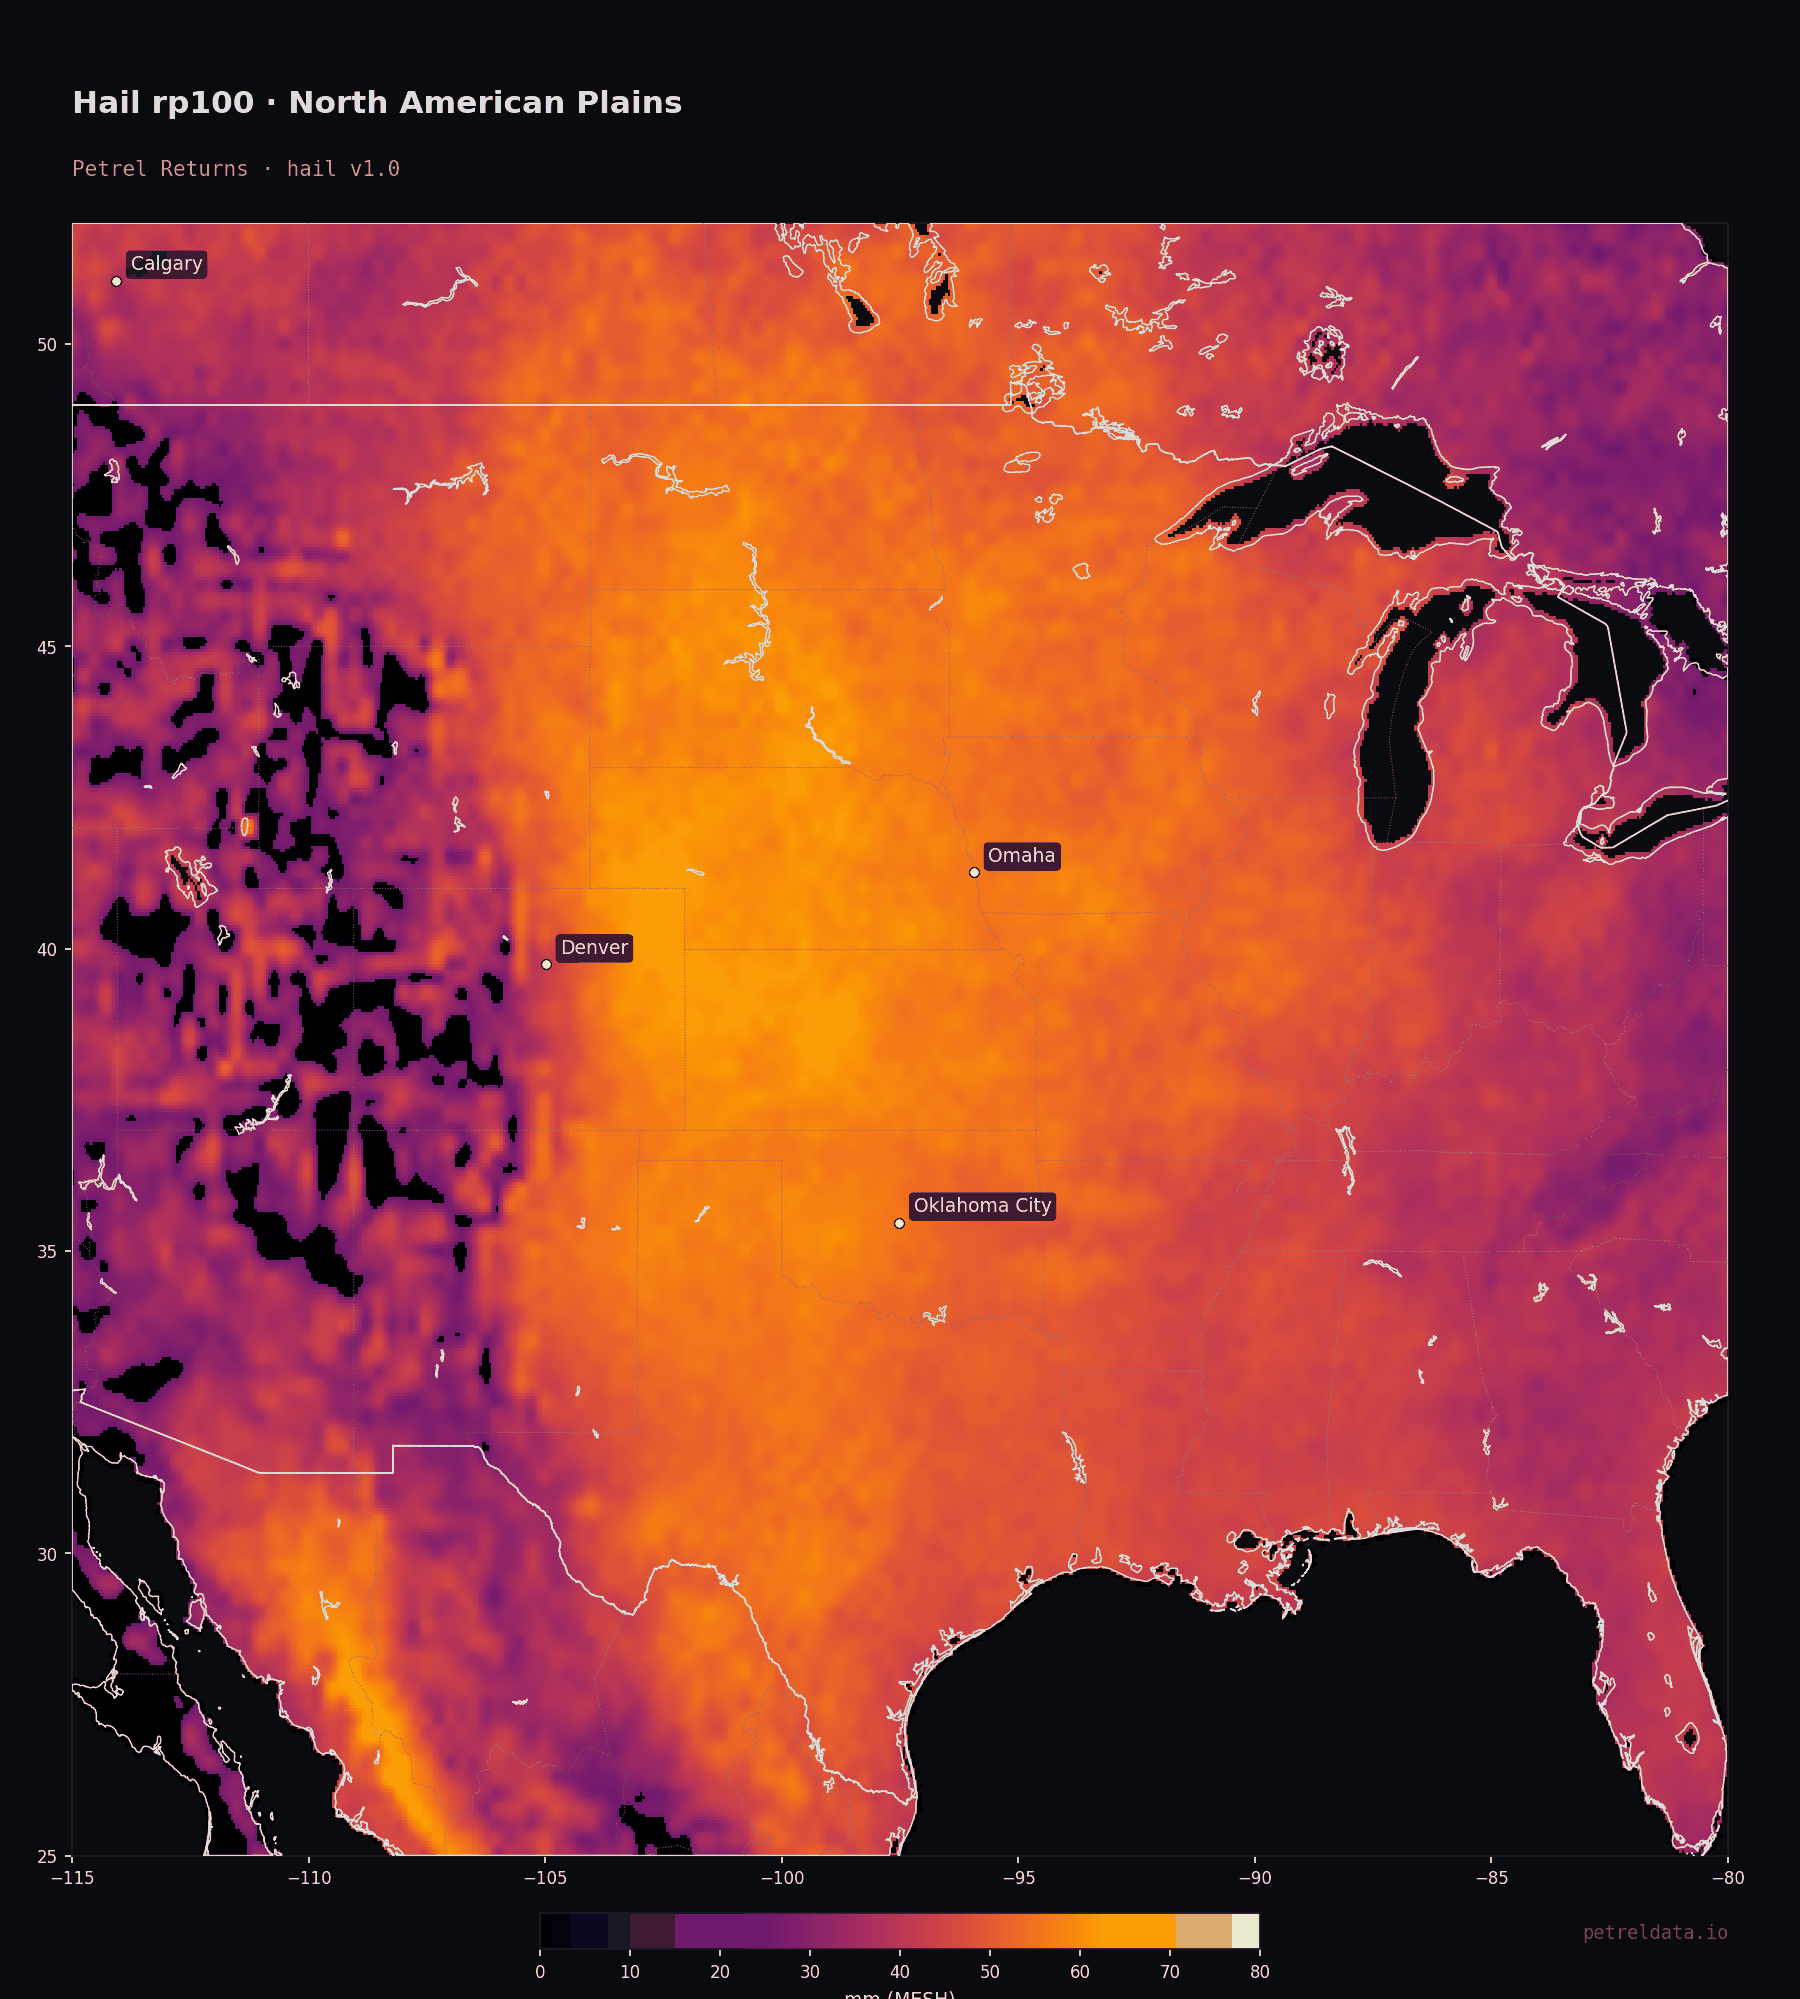
A calibrated 0–1 score per peril, 90 m native resolution, every place on Earth. Same calibration philosophy across all 25 perils, so scores compare cross-peril and cross-portfolio without re-normalization. Per-pixel uncertainty and input-coverage layers ship with every release. Sixteen hazards live today: landslide, avalanche, earthquake, lightning, soil erosion, extreme heat, extreme cold, frost/freeze, windstorm, hurricane, drought (v2.1), volcanic eruption (v1.0), tsunami (v1.1), storm surge (v1.0), wildfire (v1.0), and hail (v1.0). Nine more on the roadmap.
Where it sits: global where JBA and Fathom are single-peril; 90 m where Climate X and Cervest run kilometer-scale composites; open methodology and per-pixel uncertainty where the disclosure incumbents ship a black-box score.
For: mid-market underwriters & MGAs running submission triage · treaty reinsurers pre-filtering cessions · TCFD / ISSB / CSRD disclosure · real-estate & infrastructure due diligence · site-selection consultants · corporate location-strategy teams.
Return-periods & event sets.
For the perils where insurers price by return period, the same calibrated hazard physics behind Surfaces produces return levels in native units. Per-pixel return-period rasters are live now for hurricane (peak gust · rp50/100/250/500 yr), windstorm (peak gust · rp10/25/50/100/200 yr), extreme heat (annual-max Tmax · rp5/10/25/50/100 yr), extreme cold (annual-min Tmin · rp5/10/25/50/100 yr), drought (SPEI-12 · rp5–100 yr), storm surge (still-water inundation depth · rp50/100/250/500 yr), wildfire (probability of at least one burn · rp50/100/250/500 yr), and hail (MESH hail size · rp10/25/50/100/250/500 yr); stochastic event catalogs and AAL roll-ups remain on the roadmap.
For: primary insurers and reinsurers running event-set workflows — talk to us about early access.
A physics-informed
learning substrate.
Each surface uses the right tool for the peril — supervised ML where inventories support it, extreme-value statistics where the physics is stationary, and process models where neither applies. Every method is spatially cross-validated and calibrated to a 0–1 score. The result is a single, versioned 90 m raster per hazard, per release.
- I.Observational fusionCopernicus DEM 30 m, ESA WorldCover 10 m, Copernicus Global Land Cover, SoilGrids 250 m, ERA5 monthly extremes 1991–2020, NOAA IBTrACS, NASA FIRMS, MODIS NDVI + burn-area, Potapov canopy height, GEM seismic, HydroSHEDS, NASA LIS/OTD/ISS lightning, OpenStreetMap.
- II.Right model, by hazardGradient-boosted classifiers with spatially blocked cross-validation where event inventories support it (landslide, avalanche); fire-spread simulation emulated to 90 m and anchored to MODIS burned area for wildfire; Gumbel/GEV extreme-value statistics for return-period perils (windstorm, heat, cold); RUSLE for soil erosion; ECDF percentile-rank for cross-hazard normalization; site-amplified PGA for earthquake.
- III.Per-pixel uncertainty and coverageEvery surfaces release ships an uncertainty layer with each score — bootstrap ensemble standard deviation for ML hazards, closed-form delta-method standard error for the Gumbel/GEV physics hazards — plus an input-data coverage mask.
- IV.Validated against ground truthSpatially blocked hold-out AUC for the supervised hazards: landslide 0.97 (on 80K+ events) and avalanche 0.99. Wildfire is tested against independent fire inventories — MTBS 0.88, NBAC 0.92, EFFIS 0.82 — and reaches pixel-level AUC 0.95 against 20 years of MODIS burn history. Physics hazards validated against GEM, NOAA storm records, and station-based extremes.
Free samples now.
API + bulk access.
One ~5°×5° sample per live peril is on the public CDN today — pull with curl, open in QGIS, no signup. The hosted point-query API is self-serve and metered per request — start on the free tier, no card. Full bulk vintage downloads for enterprise customers are sold through sales.
import rasterio

# Free public sample — no API key, no signup.
# Full vintage downloads are sold through sales.

URL = "https://data.petreldata.io/samples/landslide_karakoram_90m.tif"

lon, lat = 76.513, 35.862  # K2 area

with rasterio.open(URL) as cog:
    score = next(cog.sample([(lon, lat)]))[0]

print(f"landslide susceptibility: {score:.3f}")
# → landslide susceptibility: 0.873

# Point-query API (self-serve, Stripe-metered):
# curl -H "X-API-Key: tlk…" api.petreldata.io/v1/score?lon=…&lat=…

The next decision you make
about the planet— make it with Petrel.
For underwriters, disclosure officers, and site-selection teams. Wherever the next decision needs a comparable score, on a global grid.