Score a submission address
in seconds.
Sixteen peril scores on one calibrated 0–1 scale — landslide to hail — for any address on Earth. 90 m resolution that separates the ridge from the valley. Method documented per peril, so the score you file is a score you can defend.
Triage, not modeling.
Submission enrichment without the patchwork of single-peril lookups: one screen, every live peril, the same scale.
- 01Address inPaste the submission address — or raw coordinates — into the live demo. No signup, no procurement.
- 02Pin on the structureGeocode, then drag the pin onto the exact building. Scores read from the single 90 m pixel under it.
- 03Sixteen perils, side by sideEvery live peril on the same calibrated 0–1 scale. Quote, refer, or decline — with hazard evidence in the file.
One scale. Triage rules that hold.
Every peril is a calibrated 0–1 score on the same scale, so one threshold set — quote / refer / decline — works the same for windstorm as for landslide. No re-normalizing between tools, no per-vendor units in the file.
90 m, everywhere.
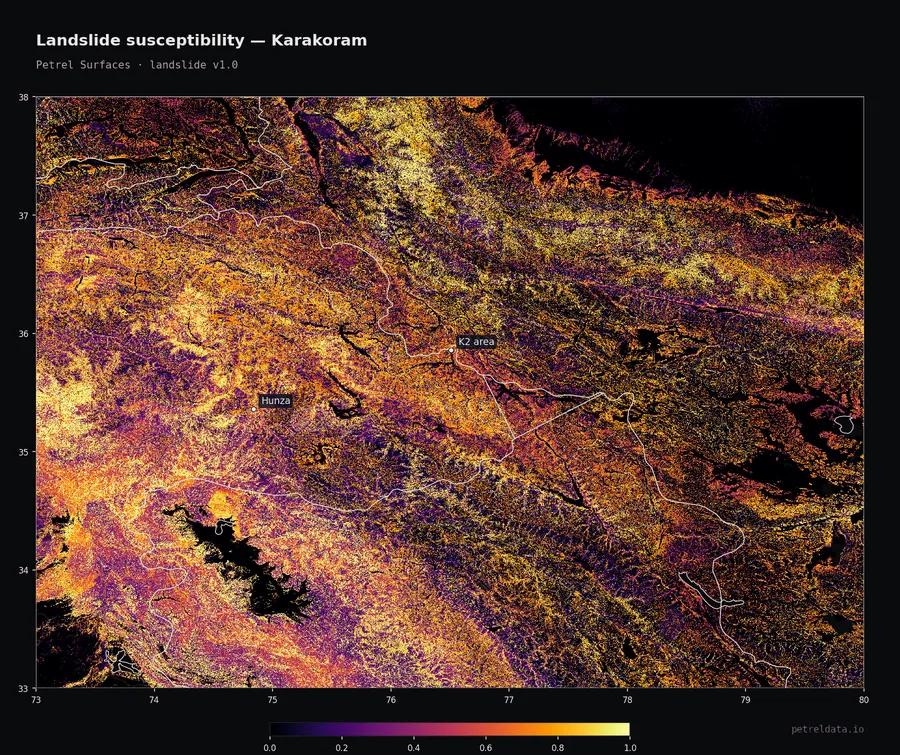
Composite scores at kilometer scale average away the hillside. At 90 m, terrain perils are terrain-shaped — the score on the ridge is not the score in the valley. Same native resolution on every landmass.
Hurricane, by return period.
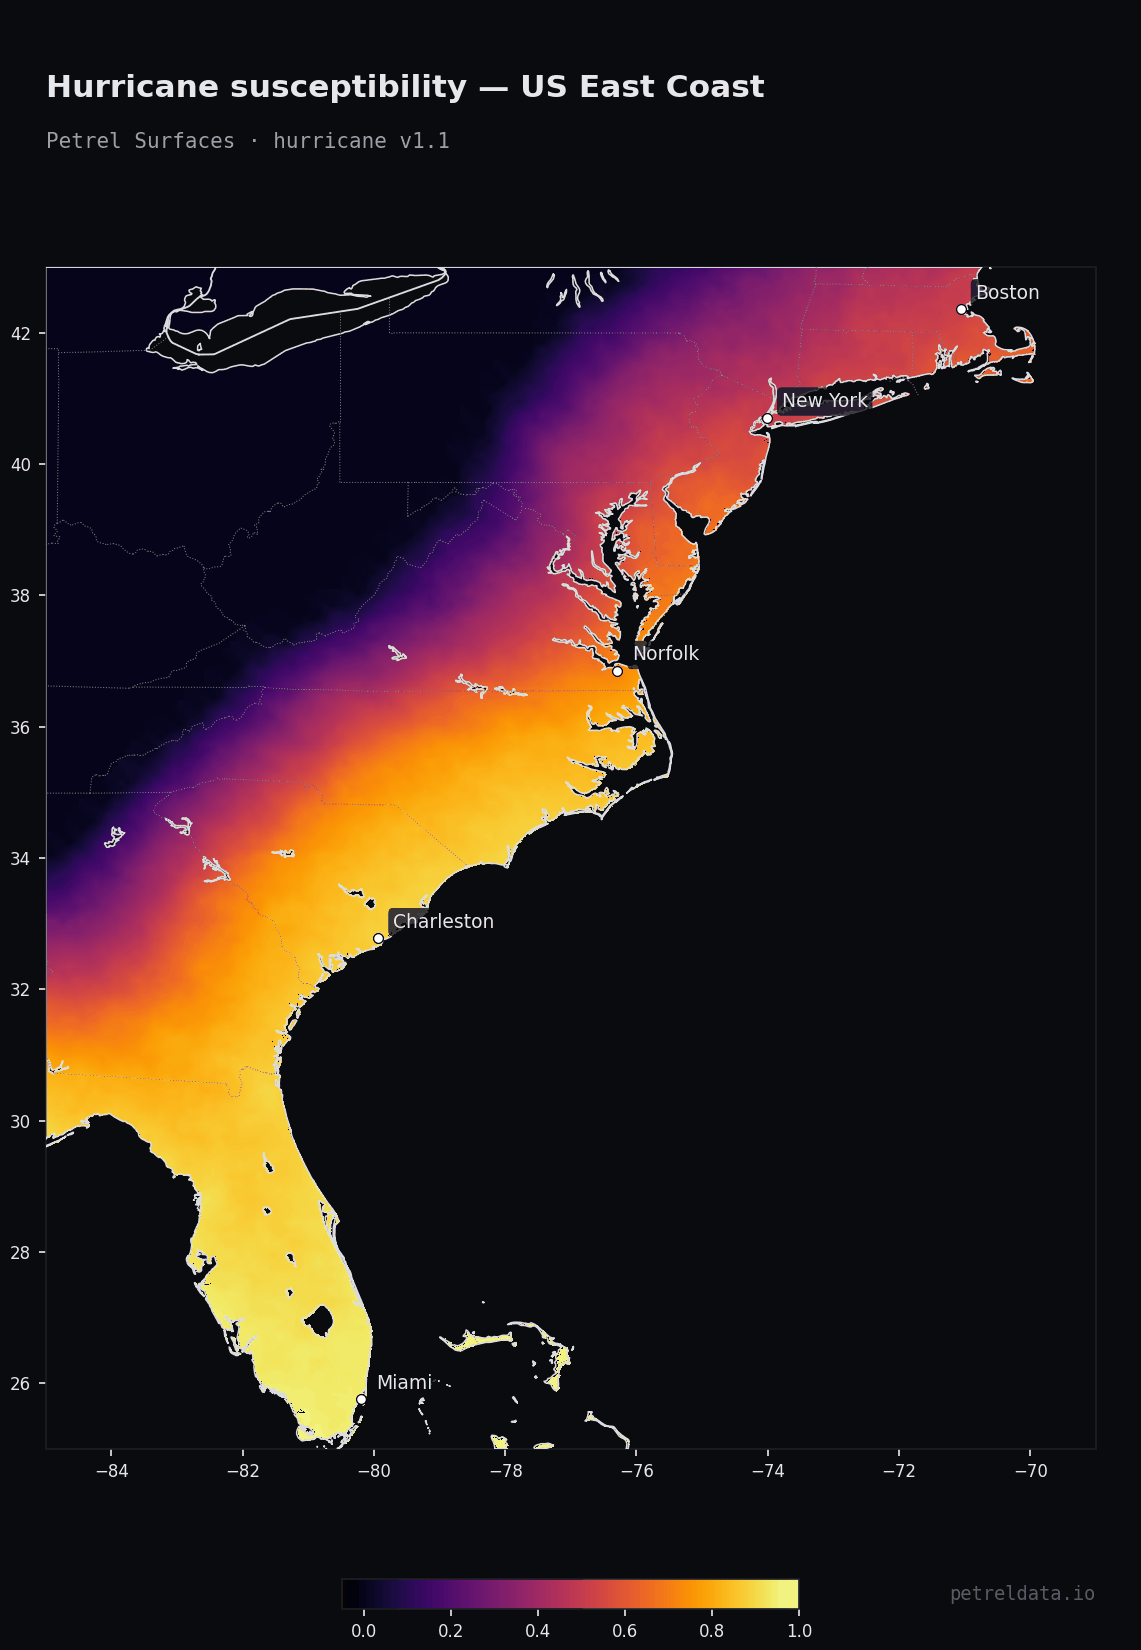
For property books: peak-gust return periods — 50, 100, 250, and 500-year — in m/s at 90 m, from 10,000 years of synthetic tracks across all six ocean basins. Hazard intensity per return period, next to the 0–1 score.
A score you can defend.
Every peril ships with its method, inputs, and validation documented — the landslide model is XGBoost on an 80,000-event inventory with spatially blocked cross-validation (AUC 0.97) — and every release is versioned, with ship dates per hazard. A documented method you can show your reinsurer.
Whole schedule?
Score up to 10,000 locations in one batch call — POST /v1/score/batch. Forward the API page to your data team.
The demo is the eval.
Score the address, enter your work email, and the hazard report lands in your inbox — evidence you can attach to the file. No procurement cycle to start.
The honest FAQ.
Not offered today. The live perils: landslide, avalanche, earthquake, windstorm, extreme heat, extreme cold, frost/freeze, lightning, soil erosion, hurricane, drought, volcanic eruption, tsunami, storm surge, wildfire, and hail.
No. Petrel ships hazard susceptibility scores and hurricane return-period gusts — evidence that informs underwriting. We don’t model losses and we don’t underwrite.
No — global land coverage on one 90 m grid. The same catalog in Osaka, Oslo, and Ohio.
Public tiers from $0 — 1,000 location lookups a month free, no card. Full pricing is public, no quote call. See the tiers →